简体中文
繁體中文
English
Pусский
日本語
ภาษาไทย
Tiếng Việt
Bahasa Indonesia
Español
हिन्दी
Filippiiniläinen
Français
Deutsch
Português
Türkçe
한국어
العربية
Gold Price Outlook: XAUUSD Spikes, Snaps Back to Fibonacci Support
Abstract:Gold prices continued their bullish ascent this morning, spiking above the 1555 level after the open. Most of those gains have already been faded-out.
Gold Price Outlook Talking Points:
It was a wild finish to last week for Gold prices as a strong breakout showed on Friday. That theme continued with a quick spike to start this weeks trade, but much of that has already been faded-out with price action returning to the Friday close level.
Gold prices remain overbought on a longer-term look but a potent backdrop of fundamental drivers has continued to bring bulls to the bid.
DailyFX Forecasts are published on a variety of markets such as Gold, the US Dollar or the Euro and are available from the DailyFX Trading Guides page. If youre looking to improve your trading approach, check out Traits of Successful Traders. And if youre looking for an introductory primer to the Forex market, check out our New to FX Guide.
Gold Prices Spike at the Open, Snap Back Fades Gains
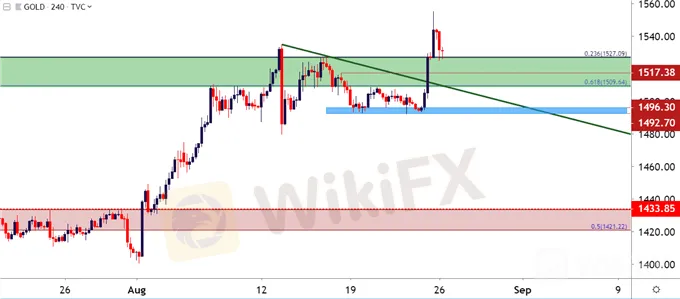
Given the weekend events, risk aversion spiked at the open with Gold prices temporarily trading-above the 1555 level. That move has since pulled back with almost the entirety of those gains now given back and price action returning back towards last weeks close.
Gold Price Four-Hour Chart

Chart prepared by James Stanley; Gold on Tradingview
This collectively produces a fairly bright backdrop on the fundamental side of Gold prices. Ongoing trade tensions will likely be met with softer monetary policy out of the Fed; both factors that can further contribute to bullish stances in Gold. =The issue at the moment is in just how strong this theme has been getting priced-in with Gold prices moving to their most overbought state since 2011, right around the time that price action topped-out above the 1900 level. Since those lows last August, Gold prices have gained as much as 34% going out to this mornings swing-high.
Gold Weekly Price Chart

Chart prepared by James Stanley; Gold on Tradingview
Gold Price Strategy
Given the overbought longer-term backdrop with a fundamental scenario that could continue to lead to further gains, and traders have a couple of options for approaching the topside of Gold at the moment. Breakout potential remains, looking for spikes to fresh highs to carry on. This would be similar to the setup looked at last week in which breakout potential existed at the Fibonacci levels of 1509 up to the 1527 marker.
Alternatively, traders can look pullbacks to support that could re-open the door for defined risk plays. Key for such approaches will be actually confirming that support is actually showing at the level so that stops can be held below those lows; and if prices do continue to break-down, losses could be mitigated, and bullish entries could be re-examined later.
Aggressive support could be sought out around the current level should buyers help to hold the lows here today. This comes in at 1527 and this price provided a bit of resistance on Friday as well as a lower-high two weeks ago. This is the 23.6% Fibonacci retracement of the 1999-2011 major move in Gold. A bit-lower is another Fibonacci level of interest at 1509, as this is the 61.8% marker of the 2012-2015 sell-off. And below that is the zone that helped to hold last weeks lows that runs from the approximate 1492-1496.
Gold Price Two-Hour Chart

Chart prepared by James Stanley; Gold on Tradingview
Disclaimer:
The views in this article only represent the author's personal views, and do not constitute investment advice on this platform. This platform does not guarantee the accuracy, completeness and timeliness of the information in the article, and will not be liable for any loss caused by the use of or reliance on the information in the article.
Read more

FBS Joins Two Prestigious Financial Events by the End of 2024
FBS is thrilled to announce our participation in two major financial events in Asia – iFX Expo Asia 2024 and Traders Fair Davao!

The U.S. dollar index and U.S. Treasury yields rebounded at the same time; gold fell by more than 1%!
The initial value of the US S&P Global Manufacturing PMI in August was 48, which was lower than expected and the lowest in 8 months; the service PMI was 55.2, which exceeded the expected 54. The number of initial jobless claims in the week ending August 17 was 232,000, slightly higher than expected, and the previous value was revised from 227,000 to 228,000. Existing home sales in July increased for the first time in five months. The PMI data was lower than expected, which was bad for the US eco

FBS IB Program Named the Best Globally
The FBS Partnership Program earned the title of the Best Introducing Broker Programme 2024 from the World Finance Awards.

FBS Ranked Among Top 5 Best Brokers by FXStreet
FBS has been recognized as one of the best Forex brokers in 2024 by FXStreet!
WikiFX Broker
Latest News
Elderly Trader Loses RM2.1M in WhatsApp Forex Scam
Spotware Unveils cTrader Store, Global Marketplace for Algo Creators
Gigamax Scam: Tracking Key Suspects in RM7 Million Crypto Fraud
WikiFX Review: Is IQ Option trustworthy?
CFI Partners with MI Cape Town, Cricket Team
Doo Financial Expands Reach with Indonesian Regulatory Licenses
5 Questions to Ask Yourself Before Taking a Trade
Quadcode Markets: Trustworthy or Risky?
Avoid Fake Websites of CPT Markets
Webull Canada Expands Options Trading to TFSAs and RRSPs
Currency Calculator


