简体中文
繁體中文
English
Pусский
日本語
ภาษาไทย
Tiếng Việt
Bahasa Indonesia
Español
हिन्दी
Filippiiniläinen
Français
Deutsch
Português
Türkçe
한국어
العربية
US Dollar Price Outlook: EUR/USD, GBP/USD, AUD/USD, USD/CAD
Abstract:It's going to be a big week for the US Dollar and likely US equities as the Jackson Hole Economic Symposium kicks off on Wednesday.
US Dollar Talking Points:
美元谈话要点:
Its a big week for the US Dollar although the economic calendar is back-loaded. After a quiet Monday and Tuesday, the Jackson Hole Economic Symposium kicks off on Wednesday and runs into the end of the week.
这是美元的重要一周,尽管经济日历是后备的。在周一和周二安静下来之后,杰克逊霍尔经济研讨会将于周三开始并持续到本周末。
Stocks are rallying ahead of the US open and this theme will likely remain center-stage ahead of and around Jackson Hole.
股市正在反弹美国公开,这个主题可能会在杰克逊霍尔及其周围保持中心位置。
US Dollar in Focus Ahead of Jackson Hole
杰克逊霍尔之前的美元焦点
The early portion of this week‘s economic data outlay is rather light, but it’s expected to be a big week for the US Dollar given the drivers showing up on Wednesday. The big item for this week is the Jackson Hole Economic Symposium, with a speech from FOMC Chair Jerome Powell scheduled for Thursday at 10AM ET. Given the heavy focus given to FOMC policy of late, this speech, along with accompanying speeches from various Fed members at the three-day event from Wednesday-Friday, will likely receive considerable attention as markets attempt to identify just how dovish the Fed might be.
本周早些时候的经济数据支出相当清淡,但考虑到司机,预计美元将是一个重要的一周周三出现。本周的重要项目是杰克逊霍尔经济研讨会,FOMC主席杰罗姆鲍威尔将于周四美国东部时间上午10点发表演讲。由于最近对FOMC政策给予了高度关注,这次演讲以及美联储各成员在周三至周五举行的为期三天的会议上发表的讲话,可能会受到相当大的关注,因为市场试图找出美联储可能会有多么温和。 。
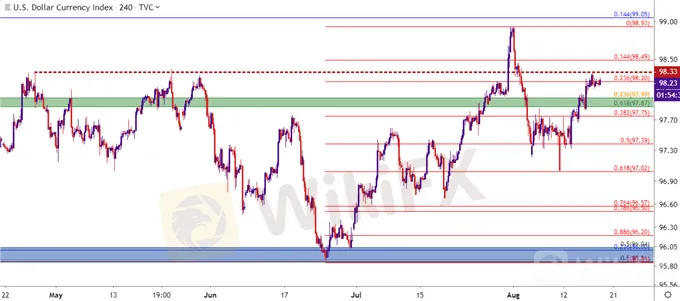
At this point, the US Dollar has recovered a large-portion of the sell-off that showed on the back of the post-Fed tariff announcement. Resistance last week showed up around the 98.33 level that previously helped to define the yearly high in the currency in May of this year. And of this week, resistance so far has held below that level, around the 23.6% Fibonacci retracement of the June-July bullish move at 98.20.
此时,美元已经收复了美联储后关税公告背后显示的大部分抛售。上周阻力位在98.33附近,之前有助于确定今年5月的货币年度高点。本周阻力位于该水平之下,在6月至7月看涨的位于98.20附近的23.6%斐波纳契折线附近。
US Dollar Four-Hour Price Chart
美元四小时价格走势图

Chart prepared by James Stanley; US Dollar on Tradingview
图表由James Stanley编制;美元在Tradingview
EUR/USD Pulls Back From Fresh Two-Week-Lows
欧元兑美元从新的两周低点反弹回来
One of the bigger surprises from last week was Olli Rehn‘s comments regarding stimulus from the ECB. Rehn pointed out the continued weakening in the European economy, illustrated by the GDP contraction from Germany in Q2, as evidence that the bank needed to come to the table with something ’significant at their September rate decision.
上周出现的一个较大的惊喜是Olli Rehn关于欧洲央行刺激计划的评论.Ren指出欧洲经济持续疲软,德国第二季度国内生产总值萎缩表明这一点,证明银行需要在9月份出现重大事件。利率决定。{/ p>
Ironically, this isn‘t the first ECB denotation towards softer policy. Last month’s ECB rate decision carried the prospect for a cut. That didn‘t happen, and despite a familiar dovishness from ECB President Mario Draghi, the single currency ripped-higher as the bank appeared reticent to commit to a rate cut just yet. But, just hours after the conclusion of the accompanying press conference, ECB ’sources mentioned that the bank was ready to cut by 10 basis points in September. This helped to slow the up-trend but given dynamics in the US Dollar, the potential still remained for a stronger Euro, particularly if the FOMC took on an even more dovish posture.
具有讽刺意味的是,这并不是欧洲央行首次表示政策走软。上个月的欧洲央行利率决定带来了减产的前景。这种情况并未发生,尽管如此欧洲央行行长马里奥·德拉吉(Mario Draghi)熟悉的鸽派,单一货币贬值,因为该银行似乎还在努力降息。但是,在随后的新闻发布会结束几小时后,欧洲央行消息人士提到该银行准备在9月份减少10个基点。这有助于减缓上升趋势,但考虑到美元的动态,欧元走强的潜力仍然存在,特别是如果联邦公开市场委员会采取更加温和的姿态。
Last weeks hat tip towards stimulus, however, came as a bit of surprise, and this helped the Euro to sell-off to fresh two week lows. If the US Dollar does remain strong, particularly around the Jackson Hole Economic Symposium, the short-side of EUR/USD can remain as attractive, with targets set towards the psychological 1.1000 level which might finally come into play after months of posturing around 1.1100.
然而,最近几周,针对经济刺激措施的提示令人感到意外,这有助于欧元贬值至新的两周低点。如果美元确实保持强势,特别是在杰克逊霍尔经济研讨会期间,欧元/美元的空方可能仍然具有吸引力,目标设定在心理1.1000水平,这可能最终会在数月的1.1100附近出现后发挥作用。
EUR/USD Four-Hour Price Chart
欧元/美元四小时价格图表

Chart prepared by James Stanley; EURUSD on Tradingview
图表由James Stanley编写; Tradingview上的EURUSD
GBP/USD: Cable Collection
GBP / USD:有线电视收藏
GBP/USD ran into a long-term trend-line a couple of weeks ago, taken from significant swing lows set in 1985 and 2016.
GBP /SD在几周前遇到了长期趋势线,取自1985年和2016年设定的大幅低点。
GBP/USD Monthly Price Chart
英镑/美元月度价格走势图

Chart prepared by James Stanley; GBPUSD on Tradingview
图表由James Stanley编写; Tradingview上的英镑兑美元
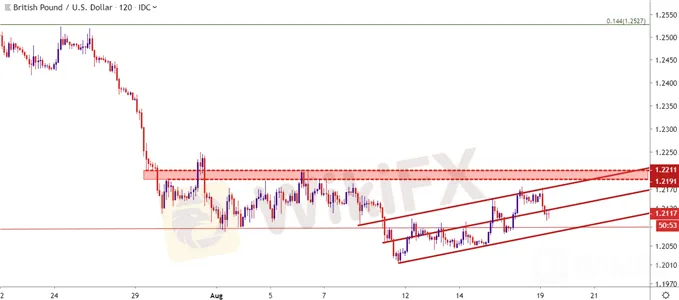
This didnt stop the declines, however, as sellers made an aggressive push towards a 1.2000 level that never came into play. Since then and over the past week, price action in the pair has trended-higher, taking on the shape of a bear flag formation. This puts focus on a resistance zone that rests a bit-higher on the chart, taken from the area around 1.2191-1.2211, which currently helps to define the August highs in the pair.
然而,这并没有阻止下跌,因为卖家积极推动从未发挥作用的1.2000水平。从那时起和过去一周,该货币对中的价格走势趋于走高,形成了熊旗形态。这将焦点放在图表上位于一点位的阻力区域,取自1.2191-1.2211附近的区域,目前该区域有助于确定该货币对的8月高位。
GBP/USD Two-Hour Price Chart
英镑/美元两小时价格图表

Chart prepared by James Stanley; GBPUSD on Tradingview
图表由James Stanley编写;关于Tradingview的GBPUSD
AUD/USD: Support Build from .6750
澳元/美元:支持从.6750构建
I had looked at this one in this week‘s Technical Forecast, asking the question as to whether the Aussie has finally found some element of support. It’s been a brutal year, to be sure, and this extends a bearish run that started in January of 2018 when the pair topped-out over the .8100 level on the chart.
本周我已经看过这个技术了预测,询问澳大利亚是否最终找到了一些支持因素的问题。可以肯定的是,这是一个残酷的一年,这延续了2018年1月开始的看跌运行,当时该货币对在图表上突破了.8100的水平。
The price of .6750 is of interest at the moment as this was the level that helped to set the low during the flash crash that showed to open the year.
目前对.6750的价格感兴趣,因为这是有助于在今年开盘的闪电崩盘期间设定低位的水平。
AUD/USD Monthly Price Chart
澳元/美元每月价格图表

Chart prepared by James Stanley; AUDUSD on Tradingview
图表由James Stanley编写;关于Tradingview的AUDUSD
This price came back into play a couple of weeks ago and sellers even made an aggressive push below; but that was quickly offset as price action returned right back to .6750. Since then, theres been a continued build of support here, leading to the question as to whether AUD/USD has finally found support.
Thi价格在几周前重新发挥作用,卖家甚至在下面做出了积极的推动;但随着价格行动回归到.6750,这很快被抵消了。从那时起,这里一直是支持,导致澳元/美元是否最终获得支持的问题。
AUD/USD Daily Price Chart
澳元/美元每日价格走势图

Chart prepared by James Stanley; AUDUSD on Tradingview
图表由James Stanley编写; Tradingview上的澳元兑美元
USD/CAD: Has the Bullish Theme Topped-Out?
美元/加元:看涨主题是否突破?
Its been a busy couple of months in USD/CAD: The pair was in an aggressive bearish trend in June and early-July, eventually finding some support just above the 1.3000 handle. As sellers postured around this price, a falling wedge formation built and this will often lead into bullish reversals. That bullish theme began to play out around the FOMC rate decision and largely continued into last week. This has led to the build of a bullish trend channel on the chart.
美元已经过了几个月的繁忙时间/加元:该货币对在6月和7月初处于激进的看跌趋势中,最终在1.3000手柄上方获得一些支撑。随着卖家在这个价格附近摆出姿势,建立了一个下跌的楔形,这通常会导致看涨逆转。这个看涨主题开始围绕FOMC利率决定展开,并在很大程度上延续到上周。这导致图表上看涨趋势通道的建立。
Of interest – last week brought a lower-high in USD/CAD as bulls were unable to test above the prior weeks swing-high. This keeps the door open for bearish strategies, particularly should the bullish channel begin to give way.
感兴趣 - 上周美元/加元走低,因为多头无法测试高于前几周摆高。这为看跌策略敞开大门,特别是看涨渠道开始让位。
USD/CAD Eight-Hour Price Chart
美元/加元8小时价格走势图

Chart prepared by James Stanley; USDCAD on Tradingview
James Stanley编制的图表;关于Tradingview的USDCAD
Disclaimer:
The views in this article only represent the author's personal views, and do not constitute investment advice on this platform. This platform does not guarantee the accuracy, completeness and timeliness of the information in the article, and will not be liable for any loss caused by the use of or reliance on the information in the article.
Read more

Weekly Analysis: XAU/USD Gold Insights
Gold prices have been highly volatile, trading near record highs due to various economic and geopolitical factors. Last week's weak US employment data, with only 114,000 jobs added and an unexpected rise in the unemployment rate to 4.3%, has increased the likelihood of the Federal Reserve implementing rate cuts, boosting gold's appeal. Tensions in the Middle East further support gold as a safe-haven asset. Technical analysis suggests that gold prices might break above $2,477, potentially reachin

USDJPY Predicted to Rise on Yen Depreciation
The USD/JPY pair is predicted to increase based on both fundamental and technical analyses. Fundamental factors include a potential easing of aggressive bond buying by the Bank of Japan (BoJ), which could lead to yen depreciation. Technical indicators suggest a continuing uptrend, with the possibility of a correction once the price reaches the 157.7 to 160 range.

Stocks Dip, Bitcoin Surges, Euro Weakens | Daily Market Update
Tech Stocks Under Pressure, Inflation Data Looms

Beginner Tips for Gold Technical Analysis - Forex4you
Are you interested in trading gold? Forex4you will provide you 6 tips for gold technical analysis, which each beginner or novice should know.
WikiFX Broker
Latest News
ASIC Sues Binance Australia Derivatives for Misclassifying Retail Clients
Geopolitical Events: What They Are & Their Impact?
Top 10 Trading Indicators Every Forex Trader Should Know
WikiFX Review: Is FxPro Reliable?
Malaysian-Thai Fraud Syndicate Dismantled, Millions in Losses Reported
Trading frauds topped the list of scams in India- Report Reveals
Why Do You Feel Scared During Trade Execution?
WikiFX Review: Something You Need to Know About Markets4you
Revolut Leads UK Neobanks in the Digital Banking Revolution
Fusion Markets: Safe Choice or Scam to Avoid?
Currency Calculator


