简体中文
繁體中文
English
Pусский
日本語
ภาษาไทย
Tiếng Việt
Bahasa Indonesia
Español
हिन्दी
Filippiiniläinen
Français
Deutsch
Português
Türkçe
한국어
العربية
Gold Price Surveys Multi-Year High, Silver Price Bullish Consolidation
Abstract:Gold remains tilted to the upside and is likely to set a new six-and-a-half high soon as global fundamental woes boost the precious metals allure.
Gold (XAU) Price, Silver (XAG) Price Analysis and Charts
Gold looking at April 2013 high.
Silver consolidating recent sharp gains.
Q3 2019 Gold Forecast and Top Trading Opportunities
Gold Momentum Remains In-Play
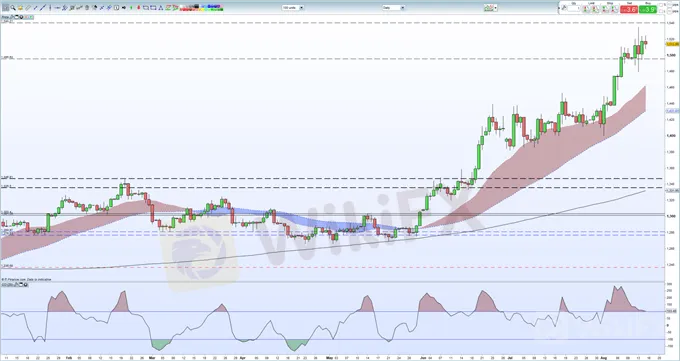
Gold is likely to make a fresh attempt at Tuesday‘s $1,535/oz. high in the near-term and may press even further ahead as fundamental positives line-up. Wednesday’s bond market moves re-affirmed market fears of a recession on the horizon, and not just in the US, driving investors back into safe-haven assets including JPY, CHF and gold. While the precious metal sold-off on Tuesday, after US President Trump announced he was delaying some Chinese tariffs, it has pulled back higher and a break above $1.524/oz. opens the way back to $1,535/oz. followed by $1,540/oz. The latter target is a re-fill of a gap on the April 8, 2013 weekly candle. Beyond here the charts point to the $1,617/oz. - $1,622/oz. zone. Support between $1,494/oz. and $1,500/oz. Buying any asset is psychologically difficult when they approach a multi-year high, but it remains the case that bulls continue to control gold.
Gold Price Weekly Forecast: Bullish Breakout Remains In-Play
Gold Price Daily Chart (January - August 15, 2019)

IG Client Sentiment data show that 63.3% of retail traders are net-long of gold, a bearish contrarian indicator. However, recent daily and weekly positional changes give us a mixed trading bias.
How to Trade Gold: Top Gold Trading Strategies and Tips
Silver – Short-Term Volatility
After touching a new 19-month high of $17.50/oz. on Tuesday, silver has sold off, but like gold remains positive. A break of the Tuesday peak brings the January 25, 2018 horizontal high around $17.70/oz. into play before the September 8, 2017 high at $18.21/oz. appears. Support between $16.65/oz. and $16.80/oz. Market volatility has picked up and needs to be monitored.
The gold/silver ratio remains steady around 88.10.
Silver Daily Price Chart (July 2018 – August 15, 2019)

How to Trade Silver: Top Trading Strategies
Traders may be interested in two of our trading guides – Traits of Successful Traders and Top Trading Lessons – while technical analysts are likely to be interested in our latest Elliott Wave Guide.
What is your view on Gold and Silver – bullish or bearish? You can let us know via the form at the end of this piece or you can contact the author at nicholas.cawley@ig.comor via Twitter @nickcawley1.
Disclaimer:
The views in this article only represent the author's personal views, and do not constitute investment advice on this platform. This platform does not guarantee the accuracy, completeness and timeliness of the information in the article, and will not be liable for any loss caused by the use of or reliance on the information in the article.
Read more

Gold Price Forecast
Bears waiting to target $1,700.

Gold Price Update
Gold Down, Investors Await Further Inflation Data

Gold Price, Silver Price Jump After Saudi Arabia Oil Field Attacks
Gold and silver turned sharply higher after the weekend‘s drone attacks on Saudi oil fields saw tensions in the area ratchet higher with US President Donald Trump warning Iran that he is ’locked and loaded.

Gold, Crude Oil Prices at Risk if ECB, US CPI Cool Stimulus Hopes
Gold and crude oil prices may be pressured if the ECB underwhelms investors dovish hopes while higher US core inflation cools Fed rate cut expectations.
WikiFX Broker
Latest News
Volkswagen agrees deal to avoid Germany plant closures
Geopolitical Events: What They Are & Their Impact?
Top 10 Trading Indicators Every Forex Trader Should Know
TradingView Launches Liquidity Analysis Tool DEX Screener
MultiBank Group Wins Big at Traders Fair Hong Kong 2024
WikiEXPO Global Expert Interview: Simone Martin—— Exploring Financial Regulation Change
'Young investors make investment decisions impulsively to keep up with current trends' FCA Reveals
Why Do You Feel Scared During Trade Execution?
CySEC Settles Compliance Case with Fxview Operator Charlgate Ltd
Malaysian Influencer Detained in Taiwan Over Alleged Role in Fraud Scheme
Currency Calculator


