简体中文
繁體中文
English
Pусский
日本語
ภาษาไทย
Tiếng Việt
Bahasa Indonesia
Español
हिन्दी
Filippiiniläinen
Français
Deutsch
Português
Türkçe
한국어
العربية
US Dollar Price Action Setups: EUR/USD, GBP/USD, AUD/USD and USD/CAD
Abstract:The US Dollar has seen a different tonality so far in July, but a short-term theme of strength runs counter to an intermediate-term scenario of weakness.
US Dollar, EUR/USD, GBP/USD, AUD/USD, USD/CAD Talking Points:
美元,欧元/美元,英镑/美元,澳元/美元,美元/加元谈话要点:
The June sell-off in the US Dollar has come into question after a bounce developed around the Q3 open. Sellers made another push this week, but will they be able to continue driving down to fresh lows?
美元的6月抛售在第三季度开盘后反弹后受到质疑。卖家本周再次推动,但他们是否能够继续降至新低?
After a week of Fed-speak combined with the Humphrey Hawkins testimony from FOMC Chair, Jerome Powell, the stage is set for continued USD-volatility as a short-term theme of strength thats shown over the past two weeks runs counter to an intermediate-term scenario of weakness. Will USD bulls or bears end up taking control of prices in the second-half of July?
经过一周的美联储发言与来自联邦公开市场委员会主席杰罗姆•鲍威尔(Jerome Powell)的汉弗莱•霍金斯(Humphrey Hawkins)的证词表明,持续的美元波动是因为过去两周显示的短期主题力量与中期弱势情况相反。 7月下半月美元多头或空头最终会控制价格吗?
US Dollar Starts Q3 with Strength After Bearish Close to Q2
美元在看跌后开始第三季度走强接近第二季度
Its been an interesting start to Q3 trade for the US Dollar. After the currency turned-over in the month of June, largely on the back of a dovish-flip at the Fed, the first week of July saw prices bounce-higher. That theme of USD-strength lasted into the first couple days of this week, until the Jerome Powell Humphrey Hawkins testimony on Wednesday, when weakness re-emerged on the back of another dovish tilt from the FOMC Chair.
这是美元第三季度交易的一个有趣开端。在6月份货币转换之后,主要是在美联储温和转跌的背景下,7月的第一周价格反弹走高。美元强势这一主题延续到本周的前几天,直到周三杰罗姆·鲍威尔·汉弗莱·霍金斯的证词,在FOMC主席再次出现温和倾向的情况下再次出现疲软。
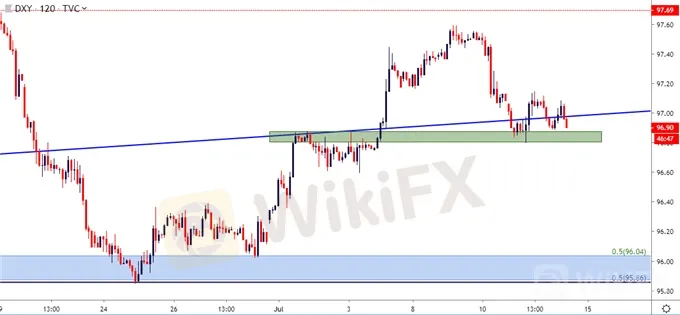
Yesterdays price action saw the US Dollar catch support around a prior area of resistance, and this keeps the door open for short-term themes of strength.
昨天的价格行动看到美元在先前的阻力位附近获得支撑,这为短期的强势主题敞开了大门。
US Dollar Two-Hour Price Chart
美国美元两小时价格图表

Chart prepared by James Stanley
图表由James Stan编写ey
On a longer-term or bigger picture basis, the more attractive side of the currency would likely be bearish. This would emanate from the recent break-below the rising wedge formation, combined with the support bounce in the Greenback coming in at a very logical area on the chart. The three-month-low in the US Dollar was set three weeks ago at 95.86, which is the 50% marker of the 2001-2008 major move in the currency. This price can function as future targets for short-side plays in the DXY index; and that scenario can be extrapolated to potential themes of USD-weakness in pairs looked at below such as EUR/USD or USD/CAD.
从较长期或更大的角度来看,货币吸引力较大的一方可能看跌。这将来自近期突破 - 上升的楔形形成,再加上美元的支撑反弹进入图表上一个非常合理的区域。美元的三个月低点在三周前设定为95.86,这是2001 - 2008年货币主要走势的50%。这个价格可以作为DXY指数中短边股的未来目标;这种情况可以推断出美元疲软的潜在主题,如下所示,如欧元/美元或美元/加元。
US Dollar Weekly Price Chart
美元每周价格走势图

Chart prepared by James Stanley
James Stanley编制的图表
EUR/USD Holds Support at Key Zone as Short Squeeze Potential Remains
欧元/美元在关键区域持有支撑,因为短期挤压潜力仍然存在
On the short-side of the US Dollar, EUR/USD remains of interest. And to be sure, this isnt necessarily because of any positive events around Europe; but more owed to the elongated bearish move that produced a series of bear traps in the month of May. That led into a strong month of June, and that strength has thus far continued to carry overtones into July trade as the pair has continued to hold higher-low support.
在美元的空头方面,欧元/美元依然存在利息。可以肯定的是,这不一定是因为欧洲周围的任何积极事件;但更多的欠款是在5月份产生一系列熊陷阱的细长利空行动。这导致了6月份强劲的一个月,而这种力量迄今为止继续带来7月份的交易,因为该货币对继续保持高位低位支撑。
Should the US Dollar continue to sell-off on the back of dovish expectations around the Federal Reserve, the topside of EUR/USD remains of interest as there are likely more long-term EUR/USD short positions that could be further squeezed by that USD-weakness. This week saw a hold of support at a higher low, coming in around the support zone that runs from 1.1187-1.1212. As long as prices remain above those supports, the door remains open for topside, and bullish target potential exists around the 1.1325 zone of prior resistance, followed by 1.1380 and then the longer-term zone of range resistance that runs from 1.1448-1.1500.
美国应该如何由于美联储周围的温和预期,美元继续抛售,欧元/美元的上行空间仍然存在利息,因为可能更多的长期欧元/美元空头头寸可能会受到美元疲软的进一步挤压。本周在支撑区附近出现支撑位于更低的位置,从1.1187-1.1212开始。只要价格保持在这些支撑位上方,上方仍然敞开大门,并且在先前阻力位1.1325附近存在看涨目标潜力,随后是1.1380然后是更长时间范围阻力范围从1.1448-1.1500开始。
EUR/USD Eight-Hour Price Chart
EUR / USD八小时价格图表

Chart prepared by James Stanley
James Stanley编制的图表
GBP/USD: Cable Snaps Back After Bears Thwarted at Flash Crash Lows
英镑/美元:在遇到闪电崩盘低点后,电缆价格回落
The year started in a very bearish manner in GBP/USD. The pair posed a ‘flash crash’ in the opening days of 2019 to slide all the way down to the 1.2442 level. That move didn‘t last for long, as bargain buyers came-in to pose a push off the lows, and by mid-March price action had already re-claimed ground above the 1.3300-handle. Since then, however, matters haven’t been quite as positive: A brutal month of May saw bears retain control for most of the period, with prices breaking-below a number of supports along the way.
这一年以英镑/美元非常看跌的方式开始。这对货币在2019年的开盘日引发了“闪电崩盘”,一路下滑至1.2442水平。这一举措并没有持续很长时间,因为讨价还价的买家出现了推动低点的推动,到3月中旬,价格行动已经重新回到1.3300上方。然而,从那以后,事情并没有那么积极:5月的残酷月份使得熊在大部分时间内保持控制,价格在此期间突破了一些支撑。
{21}
GBP/USD bears have remained in-charge through the July/Q3 open, and prices have pushed all the way down to a fresh 2019 low, finding support on Tuesday of this week around that prior flash-crash inflection point. Since then, prices have been retracing; and this opens the door for short-side trend strategies, particularly for traders looking at a return of US Dollar strength. The big operative for that theme at this point would be picking out the spot of lower-high resistance to best strike upon. On the below chart, two potential zones are investigated; and resistance showing at either re-opens the door for bearish strategies in the pair.
{21}
GBP/USD Four-Hour Price Chart
英镑/美元四小时价格走势图

Chart prepared by James Stanley
James Stanley编制的图表
AUD/USD Re-Tests Key Resistance at .7000 Big Figure
澳元兑美元重新测试关键阻力位于.7000大图
{25}
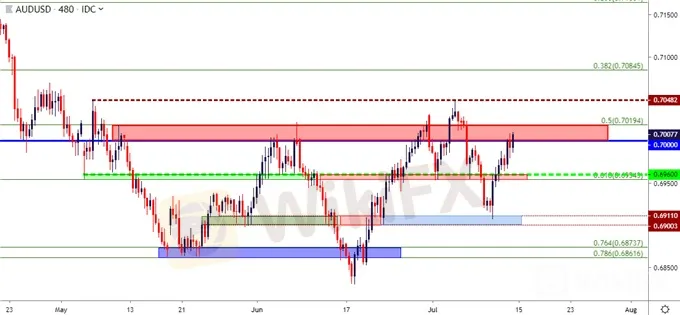
Also of interest on the side of USD-strength scenarios is the short-side of AUD/USD. The pair has posed a brisk push-higher this week on the back of that USD-weakness, helping prices to re-engage with a key zone of resistance on the chart that runs from .7000-.7020. This zone has been in-play in various ways over the past two months, helping to set numerous resistance inflections. This sets up a fairly interesting scenario for themes of USD-strength: If Dollar bulls can make a forward-push, the bearish side of AUD/USD is of interest. Potential stop placement could be investigated above the two-month-high that came into play last week at .7048. Short-side target potential exists around prior zones of support at .6955-.6960, followed by the .6903-.6911 zone that came into play on Wednesday. Beyond that, additional target potential exists around .6850, followed by bearish breakdown potential below that.
{25}
AUD/USD Eight-Hour Price Chart
澳元/美元八小时价格图表

Chart prepared by James Stanley
图表由詹姆斯·斯坦利准备
USDCAD Brings Breakdown Potential as Weak USD Meets Strong CAD
由于美元疲软导致强势加元,美元兑加元带来盈亏潜力
{29}
Back on the short-side of the US Dollar, USD/CAD remains of interest. When last months ramp of US Dollar weakness showed up around the Federal Reserve, USD/CAD put in a strong bearish move as the Canadian Dollar was catching a bid following a release of strong inflation numbers. Should US Dollar weakness continue to show with prominence, the short-side of USD/CAD can remain of interest. I had looked at bearish breakout plays in the pair a couple of weeks ago, with a breach of the 1.3132 Fibonacci level to lead to a run down to another Fibonacci level at 1.3065. That move filled-in in short order, and since then prices have shown a build of support above the 1.3000 psychological level.
{29}
USD/CAD Four-Hour Price Chart
美元/加元四小时价格走势图

Chart prepared by James Stanley
图表由James Stanley编写
A pullback to resistance at prior support can re-open the door for bearish plays in the pair. This can be sought out at that 1.3065 level up to yesterdays swing-high, which comes in around the 1.3100-handle. This can allow for stop placement above the July highs, with initial targets set to the 1.3000 big figure; and if that can break in short-order, secondary target potential exists at the Fibonacci level of 1.2928.
在先前支撑位回撤阻力位可能会重新打开看跌空间的大门。这可以在1.3065水平找到,直到昨天的摆动高点,在1.3100左右处理。这可以允许止损位于7月高点之上,初始目标设置为1.3000大数字;如果可以在短期突破,则在斐波纳契水平1.2928存在次要目标潜力。
USD/CAD Daily Price Chart
美元/加元每日价格走势图

Chart prepared by James Stanley
James Stanley编制的图表
Disclaimer:
The views in this article only represent the author's personal views, and do not constitute investment advice on this platform. This platform does not guarantee the accuracy, completeness and timeliness of the information in the article, and will not be liable for any loss caused by the use of or reliance on the information in the article.
Read more

FBS Joins Two Prestigious Financial Events by the End of 2024
FBS is thrilled to announce our participation in two major financial events in Asia – iFX Expo Asia 2024 and Traders Fair Davao!

FBS IB Program Named the Best Globally
The FBS Partnership Program earned the title of the Best Introducing Broker Programme 2024 from the World Finance Awards.

FBS Ranked Among Top 5 Best Brokers by FXStreet
FBS has been recognized as one of the best Forex brokers in 2024 by FXStreet!

FBS Increases Leverage on U.S. Indices to 1:500
FBS is excited to announce a significant update in trading conditions for our clients: starting from August 5th, 2024, the leverage on major U.S. indices, including US30, US100, and US500, is increased from 1:200 to 1:500.
WikiFX Broker
Latest News
AIMS Broker Review
The Hidden Checklist: Five Unconventional Steps to Vet Your Broker
YAMARKETS' Jingle Bells Christmas Offer!
Why is there so much exposure against PrimeX Capital?
Russia to Fully Ban Crypto Mining in 10 Regions Starting January 1, 2025
Two Californians Indicted for $22 Million Crypto and NFT Fraud
WikiFX Review: Is Ultima Markets Legit?
Colorado Duo Accused of $8M Investment Fraud Scheme
MTrading’s 2025 "Welcome Bonus" is Here
Malaysia Pioneers Zakat Payments with Cryptocurrencies
Currency Calculator


