简体中文
繁體中文
English
Pусский
日本語
ภาษาไทย
Tiếng Việt
Bahasa Indonesia
Español
हिन्दी
Filippiiniläinen
Français
Deutsch
Português
Türkçe
한국어
العربية
Crude Oil Price Outlook Mired by Death Cross Formation
Abstract:Crude oil prices stand at risk of giving back the advance from the June-low ($50.60) as a ‘death-cross’ formation takes shape.
Oil Price Talking Points
Oil prices have failed to retain the advance following the Group of 20 (G20) summit, and the advance from the June-low ($50.60) may continue to unravel as a ‘death-cross’ formation takes shape.
Crude Oil Price Outlook Mired by Death Cross Formation
The recent weakness in the price of oil appears to be catching traders off guard as the Organization of the Petroleum Exporting Countries (OPEC) and its allies plan to regulate the energy market well into 2020.
It seems as though the extension of the OPEC+ alliance was not enough to keep oil prices afloat amid the weakening outlook for global growth, and the group may have little choice but to clamp down on production especially as the US and China, the two largest consumers of crude, struggle to reach a trade deal.

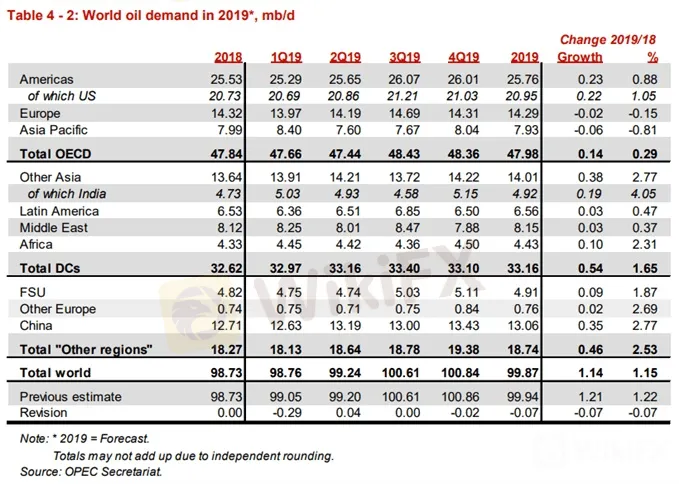
In turn, OPEC and its allies may take additional steps to balance the energy market as the most recent Monthly Oil Market Report (MOMR) highlights slower consumption for 2019.
Until then, the lack of urgency to further reduce outputs may continue to drag on crude, with recent developments raising the risk for lower oil prices as a ‘death-cross takes shape.’
Crude Oil Daily Chart

Keep in mind, the broader outlook for crude oil is no longer constructive as both price and the Relative Strength Index (RSI) snap the bullish trends from earlier this year.
At the same time, a ‘death cross’ formation has taken shape as the 50-Day SMA ($58.54) crosses below the 200-Day SMA ($58.62), with both moving averages tracking a negative slope.
The string of failed attempts to close above the Fibonacci overlap around $59.00 (61.8% retracement) to $59.70 (50% retracement) has pushed crude prices back below the $57.40 (61.8% retracement) pivot, with the next area of interest coming in around $54.90 (61.8% expansion) to $55.60 (61.8% retracement).
Next downside hurdle comes in around $51.40 (50% retracement) to $51.80 (50% expansion) followed by the overlap around $48.80 (38.2% expansion) to $49.80 (78.6% retracement).
The RSI also offers a bearish signal as the oscillator snaps the upward trend carried over from the previous month.
Sign up and join DailyFX Currency Strategist David Song LIVE for an opportunity to discuss key themes and potential trade setups.
For more in-depth analysis, check out the 3Q 2019 Forecast for Oil
Additional Trading Resources
Are you looking to improve your trading approach? Review the ‘Traits of a Successful Trader’ series on how to effectively use leverage along with other best practices that any trader can follow.
Want to know what other markets the DailyFX team is watching? Download and review the Top Trading Opportunities for 2019.
Disclaimer:
The views in this article only represent the author's personal views, and do not constitute investment advice on this platform. This platform does not guarantee the accuracy, completeness and timeliness of the information in the article, and will not be liable for any loss caused by the use of or reliance on the information in the article.
Read more

Japanese Yen Caught Out on Fed Hawkishness and Omicron. Will USD/JPY Break?
The Japanese Yen weakened on Fed Chair Powell confirmed hawkishness. APAC equities were mixed, and crude oil remains mired before OPEC+. Omicron universal uncertainty continues. Will USD/JPY gain traction?

US Dollar Leaps on Fed Re-Nomination Pumping Up Treasury Yields. Will USD Keep Going?
The US Dollar rode higher as US yields rose across the curve. Crude oil prices recovered after OPEC+ threw a curve ball. With Thanksgiving almost here, where will USD go on holiday?

Crude Oil Prices at Risk if US Economic Data Cool Fed Rate Cut Bets
Crude oil prices may fall if upbeat US retail sales and consumer confidence data cool Fed rate cut bets and sour risk appetite across financial markets.

Crude Oil Prices Stuck in Monthly Range Despite Waning US Inventories
The price of oil may continue to track the monthly range amid the string of failed attempts to test the August-high ($57.99).
WikiFX Broker
Latest News
Bitcoin in 2025: The Opportunities and Challenges Ahead
BI Apprehends Japanese Scam Leader in Manila
Join the Event & Level Up Your Forex Journey
Is There Still Opportunity as Gold Reaches 4-Week High?
Bitcoin miner\s claim to recover £600m in Newport tip thrown out
Good News Malaysia: Ready for 5% GDP Growth in 2025!
How to Automate Forex and Crypto Trading for Better Profits
Breaking News! Federal Reserve Slows Down Interest Rate Cuts
Beware: Pig Butchering Scam Targeting Vulnerable Individuals
This Economic Indicator Sparks Speculation of a Japan Rate Hike!
Currency Calculator


