简体中文
繁體中文
English
Pусский
日本語
ภาษาไทย
Tiếng Việt
Bahasa Indonesia
Español
हिन्दी
Filippiiniläinen
Français
Deutsch
Português
Türkçe
한국어
العربية
Gold Prices Explode Higher, Silver Prices Stalling at Key Resistance
Abstract:Gold Prices Explode Higher, Silver Prices Stalling at Key Resistance
Gold & Silver Price Analysis and Talking Points:
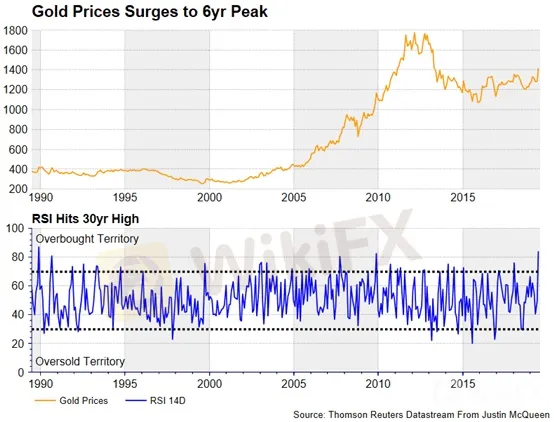
Gold Prices Continues Surge With 6yr Peak Reached
Buyers Beware | Gold Most Overbought in 30yrs
Silver Price Outlook | Stalling at Resistance
See our quarterly gold forecast to learn what will drive prices throughout Q2!
Gold Prices Continues Surge With 6yr Peak Reached
Gold prices have rallied over 10% in the past 4-weeks and set to record the best month in 3yrs amid the Federal Reserve U-Turn. Gains had been further exacerbated following last weeks break above key technical resistance in the form of the 5yr trendline, which had previously capped rallies in the precious metal.
As US data continues to underperform relative to market expectations, this further emboldens the case that the Federal Reserve will ease monetary policy with the main focus as to whether the central bank delivers a 25 or 50bps cut at the July 31st meeting. As such, with global central banks hinting at fresh policy stimulus (namely the Fed and ECB) bonds yields have continued to drop with the pool of negative yielding debt at a record high. In turn, this lowers the opportunity cost for holding gold over bonds, thus making the precious metal more attractive. Key focus for the near-term direction of gold will be dependent on commentary from Fed Chair Powell at 1800 London time (calendar).
Rising Middle East Tensions Support Gold
Overnight, gold prices had been delivered a further boost, sparking a move towards resistance at $1430-35 as tensions in the Middle East escalated further, following the Trump administrations decision to place sanctions on the Iranian Supreme Leader, which in turn saw Iran state that the path of diplomacy between the US and Iran has been closed.
Buyers Beware | Gold Most Overbought in 30yrs
While gold prices have exploded higher since the Federal Reserve confirmed the U-Turn in Monetary Policy, the precious metal however, is the most overbought in 30yrs as signaled by the daily relative strength index (14D), while on the weekly timeframe the RSI is the most overbought since August 2011. Consequently, this leaves the precious metal at risk of a pullback before another leg higher.

Source: Thomson Reuters Datastream, DailyFX
GOLD Technical Levels
Resistance 1: $1433 (August 2013 peak)
Resistance 2: $1480 (50% Fibonacci Retracement)
Resistance 3: $1500 (Psychological)
Support 1: $1400 (Psychological)
Support 2: $1377 (38.2% Fibonacci Retracement)
Support 3: $1360 (Trendline Support)
GOLD PRICE CHART: Weekly Time-Frame (Aug 2009-Jun 2019)

What You Need to Know About the Gold Market
Silver Price Outlook | Stalling at Resistance
Gains in silver prices have stalled around the psychological $15.50 level, which provides a risk of a slight pullback. However, with the gold/silver ratio at 92.5 (meaning that it takes 92 ounces of silver to buy 1 ounce of gold), which is the highest in 30yrs, risk reward looks more attractive for silver over gold in the near-term. Thus, there is increased scope for a test of the $16 handle in the longer run.
Silver Price Chart: Daily Timeframe (Oct 2018 – Jun 2019)

Disclaimer:
The views in this article only represent the author's personal views, and do not constitute investment advice on this platform. This platform does not guarantee the accuracy, completeness and timeliness of the information in the article, and will not be liable for any loss caused by the use of or reliance on the information in the article.
WikiFX Broker
Latest News
AIMS Broker Review
The Hidden Checklist: Five Unconventional Steps to Vet Your Broker
Russia to Fully Ban Crypto Mining in 10 Regions Starting January 1, 2025
YAMARKETS' Jingle Bells Christmas Offer!
Why is there so much exposure against PrimeX Capital?
Two Californians Indicted for $22 Million Crypto and NFT Fraud
WikiFX Review: Is Ultima Markets Legit?
Colorado Duo Accused of $8M Investment Fraud Scheme
MTrading’s 2025 "Welcome Bonus" is Here
Malaysia Pioneers Zakat Payments with Cryptocurrencies
Currency Calculator


