简体中文
繁體中文
English
Pусский
日本語
ภาษาไทย
Tiếng Việt
Bahasa Indonesia
Español
हिन्दी
Filippiiniläinen
Français
Deutsch
Português
Türkçe
한국어
العربية
Canadian Dollar Price Outlook: USDCAD Retrace to Key Chart Resistance
Abstract:USDCAD had a brutal start to the month of June, but over the past week shown continued signs of recovery. But bearish potential may still remain on a bigger-picture basis.
Canadian Dollar Talking Points:
加拿大元谈话要点:
USDCAD had a brutal week to kick-off June, but a big area of support came into play around the two-month lows thats since held sellers at bay.
美元兑加元在六月开始了一个残酷的一周,但是,自卖方陷入困境以来的两个月低点附近出现了大面积支撑。
USDCAD has posed a relatively mild bounce so far this week of less than 100 pips, but just ahead on the chart is a big zone of prior support that could soon come into play as resistance.
美元兑加元构成相对温和本周到目前为止反弹不到100个点,但在图表上领先是一个很大的先前支撑区域,很快就可以作为阻力发挥作用。
This weeks FX Setups looked at the long side of USDCAD, looking for a bounce from support; but now that prices have pushed up towards a key area of chart resistance, that stance may soon be ready to flip to the short-side.
本周的外汇设置考察了美元兑加元的多头,寻找支撑位的反弹;但现在价格上涨到图表阻力的关键区域,这种立场可能很快就会转向空头。
USDCAD Recovery Rally Pushes Towards Resistance
美元兑加元升级反弹推动抵抗阻力
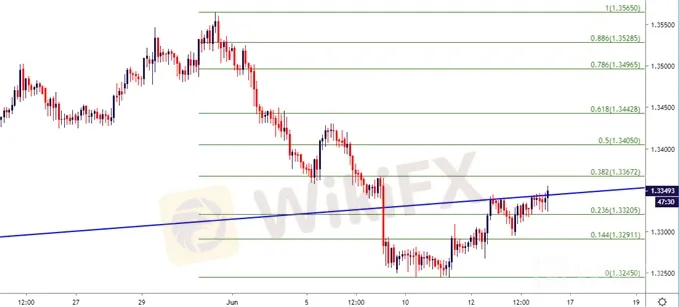
Last week was a brutal outing for USDCAD. After the pair had flickered up to a fresh five-month-high the week before, finding a bit of resistance at a key level on the chart, sellers came in, with aggression, to push prices all the way down to the late-March swing-lows. This takes place around the 1.3250 area, and after a small gap-lower to start this week‘s trade, buyers held on and have continued to push, further retracing a portion of last week’s sell-off.
上周是美元兑加元的残酷郊游。在这一周之前,他们在一个新的五个月高点闪烁之后,在图表的关键水平上找到了一点阻力,卖家以侵略的方式进入,将价格一直推到3月下旬摆动低点。这是在1.3250区域附近发生的,经过本周交易的小幅度下跌之后,买家继续推动并继续推动,进一步回撤上周抛售的一部分。
USDCAD Two-Hour Price Chart
USDCAD两小时价格图表

Chart prepared by James Stanley
James Stanley编制的图表
{12} James Stanley编制的图表 {12}
As you can see on the above chart, a bit of resistance is showing up on the under-side of a trend-line projection; and this was a key component to the longer-term setup in USDCAD until it was violated after the June open. This trend-line was the support side of a longer-term symmetrical wedge pattern that was brewing for the past couple of years, with the resistance side of that formation setting-up since May of 2017. This can keep the door open for longer-term bearish themes, particularly for those looking at a bigger-picture short thesis around the US Dollar.
正如您在上面的图表中所看到的,趋势线预测的下方会出现一些阻力;这是美元兑加元长期设置的关键组成部分,直到六月开盘后违规。这条趋势线是过去几年酝酿的长期对称楔形图案的支撑方面,自2017年5月以来该形成的阻力方面已经建立。这可以使门保持更长时间 - 术语看跌主题,特别是那些lo国王在围绕美元的更大图片短篇论文。
USDCAD Weekly Price Chart
美元兑加元每周价格图表

Chart prepared by James Stanley
USDCAD Strategy Moving Forward
USDCAD策略向前推进
While this week‘s bounce has shown decent consistency, even keeping the door open for short-term bullish trend scenarios in the early-portion of this week, as looked at on Tuesday, the longer-term setup here may be more conducive for short-side themes. This bounce has been rather mild in consideration of the prior-week sell-off, and prices haven’t yet encountered the 38.2% Fibonacci retracement of that prior move. But – that retracement level, as well as the 50% marker come-in around a very interesting spot on the chart, and this incorporates the longer-term area of prior support that runs from 1.3361-1.3385.
虽然本周的反弹已经本周早些时候,即使在本周初的短期看涨趋势情景中保持开放,也表现出良好的一致性,正如周二所看到的,这里的长期设置可能更有利于短边主题。考虑到前一周的抛售,这种反弹相当温和,价格尚未遇到此前移动的38.2%斐波纳契折线。但是 - 回撤水平,以及50%标记在图表上一个非常有趣的位置附近进入,这包含了从1.3361-1.3385开始的先前支撑的长期区域。
That zone was usable for support as the USDCAD bullish trend was holding on; but now that that trend has shown signs of further breakdown potential, it can be re-utilized for lower-high resistance potential.
由于美元兑加元看涨趋势持续,该区域可用于支撑;但现在这种趋势已显示出进一步崩溃的迹象,可以重新利用它来获得更高的阻力潜力。
{16}
USDCAD Four-Hour Price Chart
{16}

Chart prepared by James Stanley
图表由James Stanley编写
Disclaimer:
The views in this article only represent the author's personal views, and do not constitute investment advice on this platform. This platform does not guarantee the accuracy, completeness and timeliness of the information in the article, and will not be liable for any loss caused by the use of or reliance on the information in the article.
Read more

Canadian Dollar Technical Analysis: Short-term CAD Weakness Anticipated–Setups for CAD/JPY, USD/CAD
While the BOC has turned more hawkish, other fundamental factors are working against the Canadian Dollar in the near-term. Volatility and weakness in oil prices coupled with a stretch of disappointing Canadian economic data are weighing on the Loonie. According to the IG Client Sentiment Index, USD/CAD rates have a bullish bias in the near-term.

FX Week Ahead - Top 5 Events: August Canada Inflation Report & USD/CAD Rate Forecast
The August Canada inflation report (consumer price index) is due on Wednesday, September 18 at 12:30 GMT.

US Dollar Reversal Continues: EUR/USD, GBP/USD, USD/CAD
The US Dollar came into the holiday-shortened week with a full head of steam. But that's been soundly reversed. Tomorrow brings NFP and Canadian employment.

USDCAD Forecast: RSI Snaps Bullish Formation Following BoC Meeting
Recent developments in the Relative Strength Index (RSI) foreshadow a further decline in USDCAD as the indicator snaps the bullish formation carried over from July.
WikiFX Broker
Latest News
Why is there so much exposure against PrimeX Capital?
Russia to Fully Ban Crypto Mining in 10 Regions Starting January 1, 2025
Two Californians Indicted for $22 Million Crypto and NFT Fraud
Macro Markets: Is It Worth Your Investment?
WikiFX Review: Is Ultima Markets Legit?
Colorado Duo Accused of $8M Investment Fraud Scheme
What Impact Does Japan’s Positive Output Gap Have on the Yen?
RM62k Lost Investment Scam After Joining XRP Community Malaysia on Telegram
Victims of Financial Fraud in France Suffer Annual Losses of at Least €500 Million
Malaysia Pioneers Zakat Payments with Cryptocurrencies
Currency Calculator


