简体中文
繁體中文
English
Pусский
日本語
ภาษาไทย
Tiếng Việt
Bahasa Indonesia
Español
हिन्दी
Filippiiniläinen
Français
Deutsch
Português
Türkçe
한국어
العربية
Gold Price Outlook Boosted by Renewed Political Risk, Oil Tanker ‘Attack’
Abstract:Gold is on the move higher Thursday after two oil tankers were damaged in an incident in the Gulf of Iran.
Gold Price Chart and Analysis:
Gold heading higher after reports of damage to two oil tankers, sparking political fears.
Gold chart retains bullish momentum.
Gold Price Nears Fresh 14-Month High
Gold prices have moved higher Thursday after reports that two Saudi Arabian oil tankers have been damaged in the Gulf of Oman. In what has been described – but not yet confirmed – as sabotage attacks, one tanker was reported being on fire while the other was damaged during the incident.
Crude Oil Prices Spike on Possible Oil Tanker Attack in the Gulf of Oman
The latest incident will do little to settle ongoing political tensions between Ian and the US. On Monday, Iran‘s foreign minister Mohammad Javad Zariff said that the US had launched an economic war against his country and warned ominously that ’Whoever starts a war with us will not be the one who finishes it‘. On November 5, 2018 the United States fully re-imposed sanctions on Iran, targeting critical areas of Iran’s economy including energy and shipping.
US Department of the Treasury – Iran Sanctions
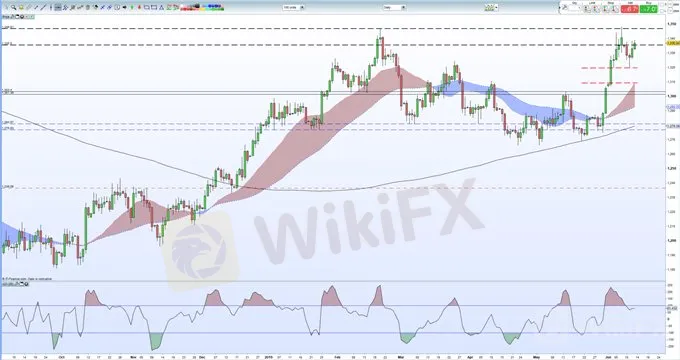
Gold retains its bullish outlook despite yesterday‘s move higher in the US dollar, and is looking to set a new 14-month high, beating last Friday’s $1,348.25/oz. All three moving averages remain bullish while gold tested and then rejected the recent double-low at $1,320/oz. a level also defining the top of a gap on the June 3 bullish candle. The US dollar continues to find support from its 200-day moving average but a decisive break and close below may well start a new move lower, boosting the value of gold.
Gold Daily Price Chart (September 2018 – June 13, 2019)

IG Client Sentimentshows that retail traders are 59.8% net-long gold, a bearish contrarian indicator. Recent daily and weekly sentiment shifts however suggest a stronger bearish bias.
Traders may be interested in two of our trading guides – Traits of Successful Traders and Top Trading Lessons – while technical analysts are likely to be interested in our latest Elliott Wave Guide.
What is your view on gold – bullish or bearish? You can let us know via the form at the end of this piece or you can contact the author at nicholas.cawley@ig.comor via Twitter @nickcawley1.
Disclaimer:
The views in this article only represent the author's personal views, and do not constitute investment advice on this platform. This platform does not guarantee the accuracy, completeness and timeliness of the information in the article, and will not be liable for any loss caused by the use of or reliance on the information in the article.
Read more

The U.S. dollar index and U.S. Treasury yields rebounded at the same time; gold fell by more than 1%!
The initial value of the US S&P Global Manufacturing PMI in August was 48, which was lower than expected and the lowest in 8 months; the service PMI was 55.2, which exceeded the expected 54. The number of initial jobless claims in the week ending August 17 was 232,000, slightly higher than expected, and the previous value was revised from 227,000 to 228,000. Existing home sales in July increased for the first time in five months. The PMI data was lower than expected, which was bad for the US eco

The U.S. dollar index returned to the 103 mark; gold once plunged nearly $40 from its intraday high!
The monthly rate of retail sales in the United States in July was 1%, far exceeding expectations; the number of initial claims last week was slightly lower than expected, falling to the lowest level since July; traders cut their expectations of a rate cut by the Federal Reserve, and interest rate futures priced that the Federal Reserve would reduce the rate cut to 93 basis points this year. The probability of a 50 basis point rate cut in September fell to 27%. The data broke the expectation of a

Gold Price Stimulates by Geopolitical Tension
Gold prices experienced their largest gain in three weeks, driven by escalating tensions in the Middle East and the easing of the U.S. dollar as markets await the crucial CPI reading due on Wednesday. Gold has surged to an all-time high above $2,460, as uncertainties surrounding developments in both the Middle East and Eastern Europe persist push the demand for safe-haven assets higher.

KVB Today's Analysis: USD/JPY Eyes Volatility Ahead of BoJ Policy Meeting and US Data
The USD/JPY pair rises to 154.35 during the Asian session as the Yen strengthens against the Dollar for the fourth consecutive session, nearing a 12-week high. This is due to traders unwinding carry trades ahead of the Bank of Japan's expected rate hike and bond purchase tapering. Recent strong US PMI data supports the Federal Reserve's restrictive policy. Investors await US GDP and PCE inflation data, indicating potential volatility ahead of key central bank events.
WikiFX Broker
Latest News
ASIC Sues Binance Australia Derivatives for Misclassifying Retail Clients
Geopolitical Events: What They Are & Their Impact?
Top 10 Trading Indicators Every Forex Trader Should Know
WikiFX Review: Is FxPro Reliable?
Malaysian-Thai Fraud Syndicate Dismantled, Millions in Losses Reported
Trading frauds topped the list of scams in India- Report Reveals
Why Do You Feel Scared During Trade Execution?
Revolut Leads UK Neobanks in the Digital Banking Revolution
Fusion Markets: Safe Choice or Scam to Avoid?
SEC Approves Hashdex and Franklin Crypto ETFs on Nasdaq
Currency Calculator


