简体中文
繁體中文
English
Pусский
日本語
ภาษาไทย
Tiếng Việt
Bahasa Indonesia
Español
हिन्दी
Filippiiniläinen
Français
Deutsch
Português
Türkçe
한국어
العربية
Gold Price Forecast - Will Feds Powell Fuel Another Gold Surge?
Abstract:Gold continues its recent rally, but momentum is slowing as resistance levels near. Will commentary from Fed Chair Jerome Powell reignite the recent surge higher.
Gold Price, Analysis and Charts.
Gold nears 13-month high, but market looks heavily overbought.
US dollar weakens as US rate cuts now dominate market thinking.
DailyFX Q2 USD and Gold Forecasts and Top 2019 Trading Opportunities.
Gold Eyes Fed Powells Commentary for Next Move
Gold continues to push higher, prompted by a weaker US dollar and continues risk-off sentiment. The US dollar‘s last leg lower was fueled by comments from St Louis Fed President Bullard who said that an interest rate cut may be’ warranted soon. Bullard is a well-known FOMC dove, so while his view carries heft, todays commentary from Fed Chair Jerome Powell will carry more weight. Chair Powell will be discussing policy strategy today at the Chicago Fed Conference.
DailyFX Economic Calendar
Yesterdays comments from Bullard sent US Treasury yields lower, with the 2-year now offering just 1.875%, down from 2.61% in mid-January this year. The US 10-year currently offers 2.09%, down from 2.79% over the same time-frame. The markets are now pricing-in around 60 basis points worth of easing in the US by the end of the year.
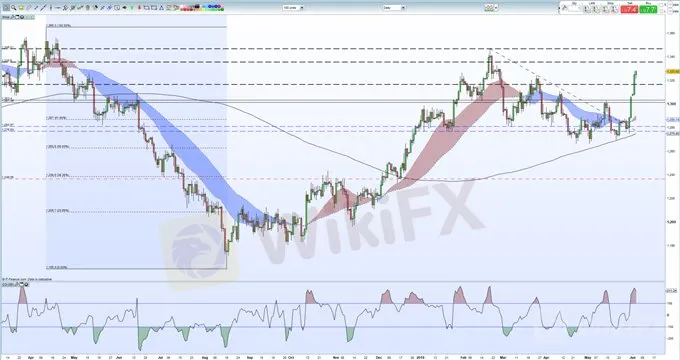
Against this backdrop, and aided by a risk-off sentiment, gold has rallied hard and is around $18 way from making a fresh 13-month high. We noted two weeks ago that gold was being compressed in a tightening pattern and that a sharp move was likely.
Gold has now rallied over $50/oz. in the last week and is looking heavily overbought using the CCI indicator. The February 20 high at $1,346/oz. is the next bull target but a short-term move here is unlikely unless the Feds Powell turns dovish is his commentary. The strength of the recent rally has left little in the way of technical support over the last week with horizontal resistance seen at $1,324/oz. ahead of $1,311/oz.
How to Trade Gold: Top Gold Trading Strategies and Tips
Gold (XAU) Daily Price Chart (March 2018 – June 4, 2019)

IG Client Sentiment data show that retail traders are 68.0% net-long gold, a bearish contrarian indicator. Recent daily and weekly sentiment shifts however suggest that gold may soon move higher despite traders being net-long.
--- Written by Nick Cawley, Market Analyst
Disclaimer:
The views in this article only represent the author's personal views, and do not constitute investment advice on this platform. This platform does not guarantee the accuracy, completeness and timeliness of the information in the article, and will not be liable for any loss caused by the use of or reliance on the information in the article.
Read more

The U.S. dollar index and U.S. Treasury yields rebounded at the same time; gold fell by more than 1%!
The initial value of the US S&P Global Manufacturing PMI in August was 48, which was lower than expected and the lowest in 8 months; the service PMI was 55.2, which exceeded the expected 54. The number of initial jobless claims in the week ending August 17 was 232,000, slightly higher than expected, and the previous value was revised from 227,000 to 228,000. Existing home sales in July increased for the first time in five months. The PMI data was lower than expected, which was bad for the US eco

The U.S. dollar index returned to the 103 mark; gold once plunged nearly $40 from its intraday high!
The monthly rate of retail sales in the United States in July was 1%, far exceeding expectations; the number of initial claims last week was slightly lower than expected, falling to the lowest level since July; traders cut their expectations of a rate cut by the Federal Reserve, and interest rate futures priced that the Federal Reserve would reduce the rate cut to 93 basis points this year. The probability of a 50 basis point rate cut in September fell to 27%. The data broke the expectation of a

Gold Price Stimulates by Geopolitical Tension
Gold prices experienced their largest gain in three weeks, driven by escalating tensions in the Middle East and the easing of the U.S. dollar as markets await the crucial CPI reading due on Wednesday. Gold has surged to an all-time high above $2,460, as uncertainties surrounding developments in both the Middle East and Eastern Europe persist push the demand for safe-haven assets higher.

KVB Today's Analysis: USD/JPY Eyes Volatility Ahead of BoJ Policy Meeting and US Data
The USD/JPY pair rises to 154.35 during the Asian session as the Yen strengthens against the Dollar for the fourth consecutive session, nearing a 12-week high. This is due to traders unwinding carry trades ahead of the Bank of Japan's expected rate hike and bond purchase tapering. Recent strong US PMI data supports the Federal Reserve's restrictive policy. Investors await US GDP and PCE inflation data, indicating potential volatility ahead of key central bank events.
WikiFX Broker
Latest News
BI Apprehends Japanese Scam Leader in Manila
Bitcoin in 2025: The Opportunities and Challenges Ahead
Join the Event & Level Up Your Forex Journey
Is There Still Opportunity as Gold Reaches 4-Week High?
Bitcoin miner\s claim to recover £600m in Newport tip thrown out
Good News Malaysia: Ready for 5% GDP Growth in 2025!
How to Automate Forex and Crypto Trading for Better Profits
FXCL Lucky Winter Festival Begins
Warning Against MarketsVox
Is the stronger dollar a threat to oil prices?
Currency Calculator


