简体中文
繁體中文
English
Pусский
日本語
ภาษาไทย
Tiếng Việt
Bahasa Indonesia
Español
हिन्दी
Filippiiniläinen
Français
Deutsch
Português
Türkçe
한국어
العربية
Gold Price Sell-Off Continues, Silver Price Hits a Six-Month Low
Abstract:Gold continues to fall and is now around $30 lower from last Tuesdays recent high, while Silver hit lows last seen in December last year.
Gold (XAU) and Silver (XAG) Price Analysis and Charts.
Gold (XAU) eyes a cluster of support.
Silver (XAG) makes afresh 2019 low as buyers disappear.
DailyFX Q2 Forecasts and Top 2019 Trading Opportunities.
Gold (XAU) Needs to Support to Hold
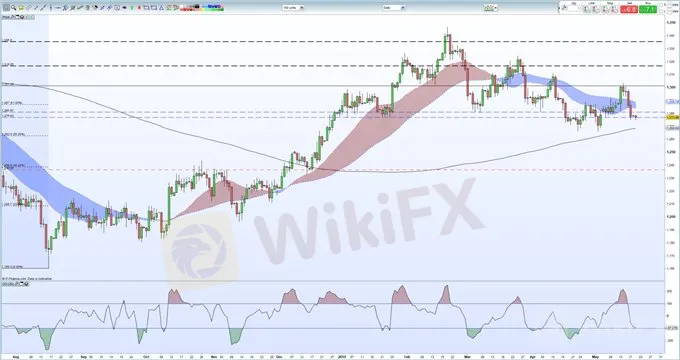
The sell-off on gold continues with the precious metal down around $30 in less than a week. Gold is under pressure from a resurgent US dollar, buoyed by last Fridays Uni of Michigan data which smashed expectations and hit a multi-year high. The important 61.8% Fibonacci retracement level at $1,287/oz. failed to provide any support when broken last week, while the $1,287 - $1,281/oz. zone made up of old horizontal support is being tested now. A clear break and close below opens the way to the recent double bottom around $1,266/oz. which is currently being guarded by the 200-day moving average at $1,268.6/oz. Below here the 50% Fibonacci retracement level at $1,262/oz heaves into view.
How to Trade Gold: Top Gold Trading Strategies and Tips
Gold (XAU) Daily Price Chart (August 2018 – May 20, 2019)

Silver (XAG) Nears a Fresh Six-Month Low
Another precious metal under heavy selling pressure. Silver is now at levels last seen in early December last year and is over 11% lower since making its recent high of $16.21/oz. in late February. The downtrend since the late-February high continues to be respected and it is possible that silver completely retraces all the way back down to the November 14 low at $13.89/oz. Psychological support at $14.00/oz. may slow the decline, while the CCI indicator shows that the market is extremely oversold.
Silver (XAG) Daily Price Chart (August 2018 - May 20, 2019)

Trading the Gold-Silver Ratio: Strategies and Tips.
IG Client Sentiment data show that retail traders are 79.1% net-long gold, a bearish contrarian indicator. Recent daily and weekly sentiment shifts give us a stronger bearish contrarian bias.
--- Written by Nick Cawley, Market Analyst
To contact Nick, email him at nicholas.cawley@ig.com
Follow Nick on Twitter @nickcawley1
Disclaimer:
The views in this article only represent the author's personal views, and do not constitute investment advice on this platform. This platform does not guarantee the accuracy, completeness and timeliness of the information in the article, and will not be liable for any loss caused by the use of or reliance on the information in the article.
Read more

Wall Street Rally on Soft CPI
The most anticipated economic indicator of the week, the U.S. Consumer Price Index (CPI), was released yesterday, coming in at 2.9%, below the 3% threshold and in line with the Producer Price Index (PPI) data from the previous day. This further sign of easing inflationary pressure in the U.S. has heightened expectations that the Federal Reserve may implement its first rate cut in September.

Wall Street Advances Ahead of CPI
The equity markets continued their upward momentum, driven by the easing of the Japanese Yen's strength. The Yen was pressured by a dovish tone from Japanese authorities, signalling that the Bank of Japan (BoJ) might keep its monetary policy unchanged amid rising global economic uncertainties.

Nasdaq Bullish, Encourage by Upbeat U.S. Job Data
The financial markets reacted positively to the upbeat Initial Jobless Claims data released yesterday, which came in at 233k, lower than market expectations. This eased concerns about a weakening labour market and the heightened recession risks that emerged after last Friday's disappointing NFP report. Wall Street benefited from the improved risk appetite, with the Nasdaq leading gains, surging by over 400 points in the last session.

Japanese Yen Eases on BoJ Dovish Statement
The Japanese Yen eased on Wednesday morning after the BoJ Deputy Governor indicated that the Japanese central bank would not raise interest rates if global markets remained unstable. This statement has calmed the market and unwound concerns about Yen carry trades. Meanwhile, the dollar has regained strength, with the dollar index (DXY) climbing above the $103 mark.
WikiFX Broker
Latest News
Top 10 Trading Indicators Every Forex Trader Should Know
ASIC Sues Binance Australia Derivatives for Misclassifying Retail Clients
WikiFX Review: Is FxPro Reliable?
Malaysian-Thai Fraud Syndicate Dismantled, Millions in Losses Reported
Trading frauds topped the list of scams in India- Report Reveals
AIMS Broker Review
The Hidden Checklist: Five Unconventional Steps to Vet Your Broker
YAMARKETS' Jingle Bells Christmas Offer!
WikiFX Review: Something You Need to Know About Markets4you
Revolut Leads UK Neobanks in the Digital Banking Revolution
Currency Calculator


