简体中文
繁體中文
English
Pусский
日本語
ภาษาไทย
Tiếng Việt
Bahasa Indonesia
Español
हिन्दी
Filippiiniläinen
Français
Deutsch
Português
Türkçe
한국어
العربية
Gold Price Struggles, Silver Continues to Test Noted Support
Abstract:Gold remains near its lowest level in three months and is struggling to get any upside momentum. Silver continues its battle with the long-term moving average.
Gold and Silver Price Analysis and Charts.
Gold struggles as the US dollar remains firm.
Silver – bulls and bears continue to trade blows around the 200-day ma.
DailyFX Q2 Forecasts and Top 2019 Trading Opportunities.
Trading the Gold-Silver Ratio: Strategies and Tips.
Gold Nears Strong Support Levels
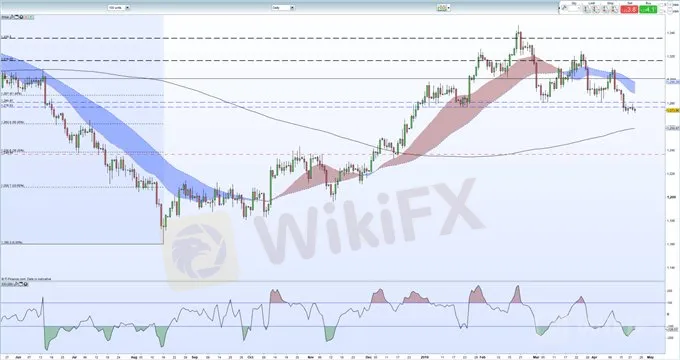
Gold remains under pressure and below a previous support zone between $1,26.8/oz and $1,280.9/oz that broke at the end of last week. The market fundamentals should provide gold with a mild bid as US President Trump ramps up the pressure on Iran by ending the current oil waivers, while the US dollar continues to trade at elevated levels and is susceptible to a sell-off, especially with the first look at US Q1 GDP at the end of the week. Gold should find strong support between $1,262/oz and $1,259/oz, the 50% Fibonacci retracement level and the 200-day moving average respectively. A break above $1,280.9/oz leaves $1,287/oz the first target. The chart continues to highlight lower highs since February 20, while the CCI indicator continues to point to an oversold market.
How to Trade Gold: Top Gold Trading Strategies and Tips.
Gold Daily Price Chart (May 2018 – April 23, 2019)

IG Client Sentimentshows that retail traders are 75.1% net-long gold, a bearish contrarian indicator. In addition, recent daily and weekly sentiment shifts give us a stronger bearish trading bias.
Silver – Supported by the 20-Day Moving Average
Silver continues to test the 200-day moving average, an indicator that has been under pressure since early April. The indicator, currently at $14.96/oz has been broken but not closed below, adding short-term credibility to its support. If we do break and close below, the 23.6% Fibonacci retracement at $14,91/oz will come into play before the April 15 low at $14.85/oz. The CCI indicator shows the metal just moving out of oversold territory.
How to Trade Silver: Top Silver Trading Strategies.
Silver Daily Price Chart (July 2018 – April 23, 2019)

Disclaimer:
The views in this article only represent the author's personal views, and do not constitute investment advice on this platform. This platform does not guarantee the accuracy, completeness and timeliness of the information in the article, and will not be liable for any loss caused by the use of or reliance on the information in the article.
Read more

Gold Price Forecast
Bears waiting to target $1,700.

Gold Price Update
Gold Down, Investors Await Further Inflation Data

Gold Price, Silver Price Jump After Saudi Arabia Oil Field Attacks
Gold and silver turned sharply higher after the weekend‘s drone attacks on Saudi oil fields saw tensions in the area ratchet higher with US President Donald Trump warning Iran that he is ’locked and loaded.

Gold, Crude Oil Prices at Risk if ECB, US CPI Cool Stimulus Hopes
Gold and crude oil prices may be pressured if the ECB underwhelms investors dovish hopes while higher US core inflation cools Fed rate cut expectations.
WikiFX Broker
Latest News
Tokyo Police Arrest 4 for Unregistered FX Trading Scheme
BSP Shuts Down Uno Forex Over Serious AML Violations
ACY Securities Expands Global Footprint with South Africa Acquisition
Rupee gains against Euro
WikiEXPO Global Expert Interview: The Future of Financial Regulation and Compliance
DFSA Warns of Fake Loan Approval Scam Using Its Logo
Consob Sounds Alarm: WhatsApp & Telegram Users Vulnerable to Investment Scams
CySEC Revokes UFX Broker Licence as Reliantco Halts Global Operations
Axi Bids AUD 52M to Acquire Low-Cost Broker SelfWealth, Outbidding Competitor Bell Financial
Crypto Influencer's Body Found Months After Kidnapping
Currency Calculator


