简体中文
繁體中文
English
Pусский
日本語
ภาษาไทย
Tiếng Việt
Bahasa Indonesia
Español
हिन्दी
Filippiiniläinen
Français
Deutsch
Português
Türkçe
한국어
العربية
Bitcoin (BTC) Rally Eyes $6,000+, Litecoin (LTC) Price Building Momentum
Abstract:Bitcoin (BTC) continues to lead the cryptocurrency market higher and is making a fresh attempt at a noted technical level which, if broken, sees a potential jump to $6,000+ in the short-term
Bitcoin (BTC) and Litecoin (LTC) Price Outlook, Charts and Analysis:
比特币(BTC)和Litecoin(LTC)价格展望,图表和分析:
Bitcoin (BTC) price chart showing increasing bullish bias.
比特币(BTC)价格图表显示出越来越大的看涨偏见。
Litecoin (LTC) nearing a technical breakout.
Litecoin(LTC)接近技术突破。
IG Client Sentiment Datashows how retail are positioned in a variety of cryptocurrencies. See how daily and weekly positioning can affect our trading bias.
IG Client Sentiment数据显示零售在各种加密货币中的定位。了解每日和每周定位如何影响我们的交易偏见。
Bitcoin (BTC) trade data shows 80.9% of traders are net-long.
比特币(BTC)交易数据显示80.9%的交易者是净多头。
{5}
Ripple(XRP) trade data shows 97.7% of traders are net-long.
{5}
Ether (ETH) trade data shows 92.1% of traders are net-long.
以太(ETH)交易数据显示,92.1%的交易者为净多头。 / p>
Litecoin (LTC) trade data shows 92.2% of traders are net-long.
Litecoin(LTC)交易数据显示,92.2%的交易者为净多头。
Bitcoin (BTC) Still Needs to Break $5,648 to Trigger Next Leg to $6,000+
比特币(BTC)仍需突破5,648美元引发下一轮走势达到6,000美元+
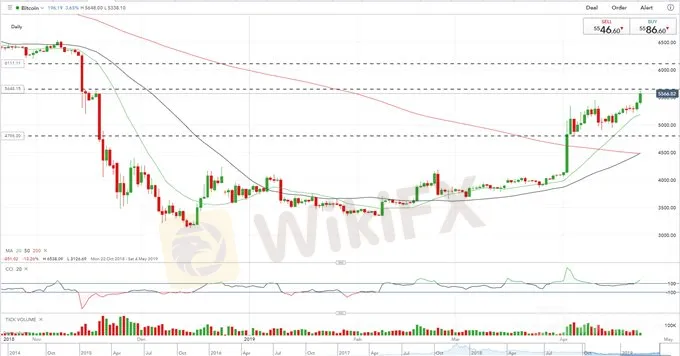
Bitcoin continues to move higher and is setting itself up for a push at $6,000 or more with the chart continuing to highlight a bullish bias. Last week we identified a gap that needs to be filled between $5,648 and $6,111 and this remain relevant with a close above $5,648 the first stage. We also have a ‘golden cross’ being made – 50-day ma moving above the 200-day ma – a bullish technical sign as momentum continues to turn positive. Higher lows continue to be made along with a series of higher highs off the February 8 candle.
比特币继续走高,并且在图表继续突显看涨偏见的情况下推动自己达到6000美元或更高的推动力。上周我们发现需要填补5,648美元至6,111美元之间的差距,这仍然与第一阶段收盘价高于5,648美元相关。我们还有一个“黄金十字架” - 50日均线在200日均线上方移动 - 这是一个看涨技术指标,因为动能继续转为正面。 2月8日的蜡烛继续保持较高的低点以及一系列更高的高点。
A Guide to Day Trading Bitcoin and Other Cryptocurrencies.
比特币和其他加密货币日交易指南。
{11}
Bitcoin (BTC) Daily Price Chart (October 2018 – April 23, 2019)
{11}

Litecoin (LTC) – Bullish Descending Triangle?
Litecoin(LTC) - 看涨下跌三角?
Another chart that is now showing a positive set-up after drifting sideways to marginally higher over the past weeks. The sharp rally on April2/3 that sent LTC from $60 to nearly $100 has formed the side of a descending triangle with the base around $73. This base has been rejected twice so far. As the price nears the downward slope a sharp break to the upside becomes more likely, especially if LTC moves back above the 20-day ma. According to the CCI indicator, Litecoin is just turning out of oversold territory, adding to the bullish hue.
另一张图表显示,在过去几周横向漂移至略微走高之后,市场呈现积极态势。 4月2日/ 3日大幅上涨使LTC从60美元上涨至近100美元,形成了下跌三角形的一侧,基数在73美元左右。这个基地被拒绝了到目前为止。随着价格接近下跌趋势,突然向上突破的可能性更大,特别是如果LTC回升至20日均线上方。根据CCI指标,Litecoin刚刚走出超卖区域,增加了看涨的色调。
Litecoin (LTC) Daily Price Chart (August 2018 - April 23, 2019)
Litecoin(LTC)每日价格走势图(2018年8月 - 2019年4月23日)

Disclaimer:
The views in this article only represent the author's personal views, and do not constitute investment advice on this platform. This platform does not guarantee the accuracy, completeness and timeliness of the information in the article, and will not be liable for any loss caused by the use of or reliance on the information in the article.
WikiFX Broker
Latest News
BSP Shuts Down Uno Forex Over Serious AML Violations
ACY Securities Expands Global Footprint with South Africa Acquisition
Tokyo Police Arrest 4 for Unregistered FX Trading Scheme
Rupee gains against Euro
Axi Bids AUD 52M to Acquire Low-Cost Broker SelfWealth, Outbidding Competitor Bell Financial
Crypto Influencer's Body Found Months After Kidnapping
US Regulators Tighten Oversight on Bank Anti-Money Laundering Efforts
Doo Group Expands Its Operations with CySEC License
RM900,000 Scammed: The Hidden Dangers of Online Investment Schemes
5 Advantages of Choosing a Regulated Broker
Currency Calculator


