简体中文
繁體中文
English
Pусский
日本語
ภาษาไทย
Tiếng Việt
Bahasa Indonesia
Español
हिन्दी
Filippiiniläinen
Français
Deutsch
Português
Türkçe
한국어
العربية
3 Charts to Follow: Crude Oil, Gold and Bitcoin (BTC) Price Analysis
Abstract:Crude oil, Gold and Bitcoin charts are all at, or close to, important technical levels that may direct future price action.
Crude Oil, Gold and Bitcoin (BTC) Price Analysis and Charts.
原油,黄金和比特币(BTC)价格分析和图表。
Crude oils supportive uptrend remains in place as rally slows.
原油
Gold oversold but struggling to hold support.
黄金超卖,但仍难以获得支持。
Bitcoin (BTC) forming a bullish pennant.
比特币(BTC)形成看涨三角旗。
DailyFX Q2 Forecasts and Top 2019 Trading Opportunities.
DailyFX Q2预测和2019年顶级交易机会。
Crude Oil –Rally Intact but Slowing Down
原油 - 全面反应但却放缓
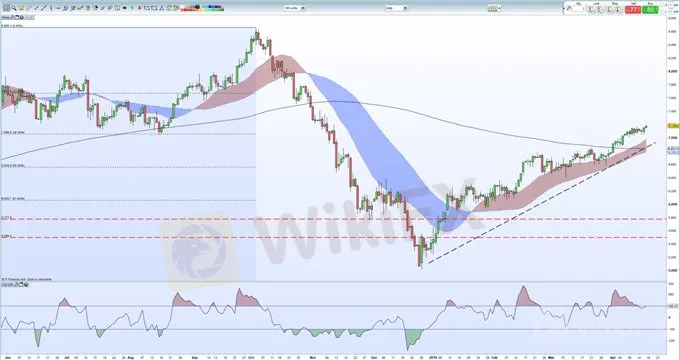
Crude oil‘s 40%+ rally since December 26 last year is slowing down with price ranges narrowing and fresh highs becoming harder to print. The chart shows a positive backdrop with crude above all three moving averages and respecting this year’s bullish trendline. Crude produced a bullish signal earlier this month when the 20-day ma went above the 200-day ma and it looks likely the 50-day ma will do the same shortly producing a ‘golden cross’. Support currently starts at $70.56/bbl. off the 23.2% Fibonacci retracement of the June 2017 – October 2018 rally before the three moving averages come into play between $69.74/bbl. and $67.86/bbl. The longer-term upside target is $76.71/bbl. the 23.6% Fibonacci retracement.
自去年12月26日以来原油价格上涨40%+涨幅正在放缓,价格范围缩小新鲜的高点越来越难以印刷。图表显示了一个积极的背景,原油价格高于所有三个移动平均线,并且遵守今年的看涨趋势线。本月早些时候原油产生了一个看涨信号,当时20日均价位于200日均线上方,看起来这50天的马力很可能会在短期内产生“黄金交叉”。支撑位目前为70.56美元/桶。在三个移动平均值在69.74美元/桶之间发挥作用之前,2017年6月至2018年10月期间反弹的23.2%斐波纳契回撤位。和$ 67.86 / bbl。长期上行目标是76.71美元/桶。 23.6%的斐波那契回撤。
How to Trade Oil: Crude Oil Trading Strategies and Tips.
如何交易石油:原油交易策略和提示。
Crude Oil Daily Price Chart (June 2018 – April 17, 2019)
原油每日价格走势图( 2018年6月 - 2019年4月17日)

Gold – Chart Bias Remains Negative in the Medium-Term
Gold - 图表偏差在中期保持负面
The $35/oz. sell-off in gold since last Thursday has pushed the precious metal through a notable support level provided by the 61.8% Fibonacci retracement at $1,287/oz. and back to the lowest level seen this year. The CCI indicator shows the recent move has pushed gold into oversold territory which may help stem losses, but the overall chart set-up continues to suggest lower prices ahead. The next area of support is seen between $1,262.8/oz. (50% Fib) and the 200-day moving average currently at $1,257.6/oz. Lower highs dominate off the February 20 high at $1,347/oz.
35美元/盎司。自上周四以来抛售黄金已推动贵金属通过61.8%斐波那契回撤位于1,287美元/盎司所提供的显着支撑位。并回到今年看到的最低水平。 CCI指标显示近期的走势已经推动黄金进入超卖领域,这可能有助于抑制亏损,但整体图表的建立继续暗示未来价格走低。下一个支撑位在1,262.8美元/盎司之间。 (50%斐波拉契)和200天的电影目前平均价格为1,257.6美元/盎司。较低的高位在2月20日的高点位于1,347美元/盎司之上。
How to Trade Gold: Top Gold Trading Strategies and Tips.
如何交易黄金:顶级黄金交易策略和提示。
Gold Daily Price Chart (May 2018 – April 17, 2019)
黄金每日价格走势图(2018年5月 - 2019年4月17日)

Bitcoin (BTC) – Flagging Higher Prices?
比特币(BTC) - 标价更高的价格?
{15}
Bitcoin (BTC) Daily Price Chart (August 2018 – April 17, 2019)
比特币(BTC)每日价格图表(2018年8月 - 2019年4月17日)

IG Client Sentiment shows how retail traders are positioned in a wide range of currencies, commodities and cryptocurrencies. See how recent changes in positioning affect our trading bias.
IG Client Sentiment显示零售交易者是如何定位于各种货币,商品和加密货币。了解最近的定位变化如何影响我们的交易偏见。
Disclaimer:
The views in this article only represent the author's personal views, and do not constitute investment advice on this platform. This platform does not guarantee the accuracy, completeness and timeliness of the information in the article, and will not be liable for any loss caused by the use of or reliance on the information in the article.
Read more

KVB Today's Analysis: USD/JPY Eyes Volatility Ahead of BoJ Policy Meeting and US Data
The USD/JPY pair rises to 154.35 during the Asian session as the Yen strengthens against the Dollar for the fourth consecutive session, nearing a 12-week high. This is due to traders unwinding carry trades ahead of the Bank of Japan's expected rate hike and bond purchase tapering. Recent strong US PMI data supports the Federal Reserve's restrictive policy. Investors await US GDP and PCE inflation data, indicating potential volatility ahead of key central bank events.

Today's analysis: USDJPY Poised for Increase Amid Bank of Japan's Strategy
The USD/JPY is expected to rise. The Bank of Japan will keep interest rates between 0 and 0.1% and continue its bond purchase plan but may reduce purchases and raise rates in July based on economic data. Technically, the pair is trending upward with resistance at $158.25 and $158.44, and support at $157.00, $156.16, and $155.93.

Crude Oil Prices at Risk if US Economic Data Cool Fed Rate Cut Bets
Crude oil prices may fall if upbeat US retail sales and consumer confidence data cool Fed rate cut bets and sour risk appetite across financial markets.

Bitcoin (BTC) Price Battles Recent Highs as Technical Indicators Clash
Bitcoins recent $1300 rebound has ground to a halt as buyers and sellers battle to gain the upper hand. The daily chart is not giving either a great deal of help.
WikiFX Broker
Latest News
Bitcoin in 2025: The Opportunities and Challenges Ahead
BI Apprehends Japanese Scam Leader in Manila
Join the Event & Level Up Your Forex Journey
Is There Still Opportunity as Gold Reaches 4-Week High?
Bitcoin miner\s claim to recover £600m in Newport tip thrown out
Good News Malaysia: Ready for 5% GDP Growth in 2025!
FXCL Lucky Winter Festival Begins
Warning Against MarketsVox
Is the stronger dollar a threat to oil prices?
Rising Risk of Japan Intervening in the Yen's Exchange Rate
Currency Calculator


