简体中文
繁體中文
English
Pусский
日本語
ภาษาไทย
Tiếng Việt
Bahasa Indonesia
Español
हिन्दी
Filippiiniläinen
Français
Deutsch
Português
Türkçe
한국어
العربية
British Pound Currency Volatility Could Collapse from Brexit Can-Kicking
Abstract:Implied volatility measures for the British Pound plunged following the European Council's offer to delay Brexit again, but less uncertainty could provide GBP traders with a unique opportunity.
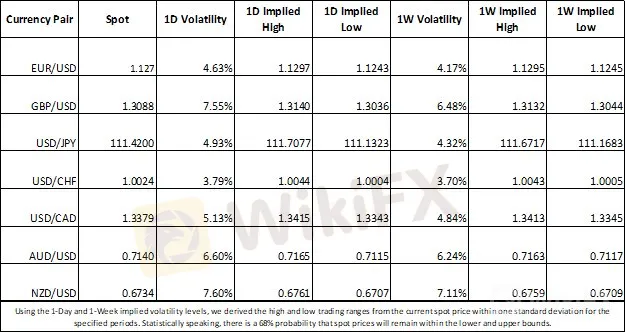
GBPUSD overnight implied volatility took a nosedive from 12.7 percent yesterday to a mere 7.6 percent today in response to the latest Brexit developments. The move lower in anticipated British Pound price action likely follows the reduced probability of no-deal Brexit after EUCO President Donald Tusk and European Union leaders agreed to delay the UKs departure for a second time.
FOREX MARKET IMPLIED VOLATILITIES AND TRADING RANGES


Prior to the EUCO‘s offer to extend the Brexit deadline again, the UK was slated to sever itself from the EU on April 12 without a deal following British MPs rejection of Theresa May’s Withdrawal Agreement three separate times.
Check out this Brexit Timeline for a chronological list of events surrounding the UKs withdrawal from the EU and how negations have affected markets.
Consequently, the ongoing impasse in the House of Commons increased the risk of a no-deal, ‘hard’ Brexit which bid up Sterling implied volatility measures. Now that British Parliament has until October 31 to decide the next direction of Brexit, currency option traders are no longer expecting significant price swings in the near future which is expressed by GBPUSD 1-week implied volatility plunging to its lowest level since December 2018.
GBPUSD IMPLIED VOLATILITY PRICE CHART: DAILY TIME FRAME (OCTOBER 01, 2018 TO APRIL 11, 2019)

Implied volatility is an indirect variable derived from currency option contracts and is often viewed as a quantitative measure of hedging costs. With less uncertainty, hedging costs tend to fall as well considering the reduced level of risk. Consequently, the 6-month Brexit delay appears to have significantly reduced the risk of a major move in GBPUSD. However, this could in turn suggest that GBPUSD may trade in more established ranges instead of daily Brexit headlines regularly threatening sudden swells that carry the risk of developing into breakouts.
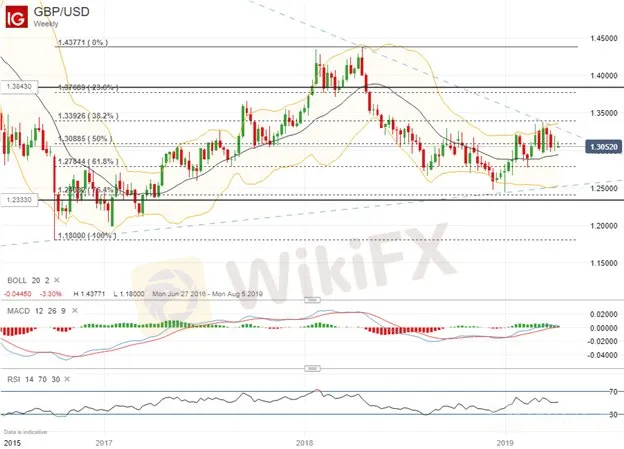
GBPUSD PRICE CHART: WEEKLY TIME FRAME (JUNE 26, 2016 TO APRIL 11, 2019)

According to the derived 7-month implied volatility which encompasses the new October 31 Brexit deadline, GBPUSD will likely trade within a range of 1.2333 and 1.3843 over the next 7 months. This implied trading range aligns closely with the 76.4 percent and 23.6 percent Fibonacci retracement lines drawn from the low in October 2016 and high in April 2018 - levels that could also provide technical support and resistance. Although, spot prices could continue to coil between rising and falling trendlines shown above while the 61.8 percent and 38.2 percent Fibs may serve as other areas of confluence.
GBPUSD TRADER SENTIMENT

Check out IGs Client Sentiment here for more detail on the bullish and bearish biases of EURUSD, GBPUSD, USDJPY, Gold, Bitcoin and S&P500.
The latest client positioning data from IG shows that 69.0 percent of GBPUSD traders are net-long with the ratio of traders long to short at 2.23 to 1. According to the data, the number of traders net-long is 3.9 percent lower than yesterday but 14.5 percent higher than last week. Similarly, the number of traders net-short is 0.5 percent higher than yesterday and 15.7 percent lower than last week.
Disclaimer:
The views in this article only represent the author's personal views, and do not constitute investment advice on this platform. This platform does not guarantee the accuracy, completeness and timeliness of the information in the article, and will not be liable for any loss caused by the use of or reliance on the information in the article.
Read more

KVB Market Analysis | 23 August: JPY Gains Ground Against USD as BoJ Signals Possible Rate Hike
JPY strengthened against the USD, pushing USD/JPY near 145.00, driven by strong inflation data and BoJ rate hike expectations. Japan's strong Q2 GDP growth added support. However, USD gains may be limited by expectations of a Fed rate cut in September.

KVB Market Analysis | 22 August: Gold Stays Strong Above $2,500 as Fed Rate Cut Hints Loom
Gold prices remain above $2,500, near record highs, as investors await the Federal Open Market Committee minutes for confirmation of a potential Fed rate cut in September. The Fed's dovish shift, prioritizing employment over inflation, has weakened the US Dollar, boosting gold. A recent revision showing the US created 818,000 fewer jobs than initially reported also strengthens the case for a rate cut.

KVB Market Analysis | 21 August: USD/JPY Stalls Near 145.50 Amid Diverging Economic Indicators
USD/JPY holds near 145.50, recovering from 144.95 lows. The Yen strengthens on strong GDP, boosting rate hike expectations for the Bank of Japan. However, gains may be limited by potential US Fed rate cuts in September.

KVB Market Analysis | 20 August: Gold Prices Remain Near Record High Amid US Rate Cut Expectations
Gold prices remain near record highs, driven by expectations of a US interest rate cut and a weakening US Dollar. Investors are focusing on the upcoming Jackson Hole Symposium, where Fed Chair Jerome Powell's speech will be closely watched for clues on the Fed's stance. Additionally, the release of US manufacturing data (PMIs) is expected to influence gold's direction.
WikiFX Broker
Latest News
Attention! Goldman Sachs Cuts Gold Target to $2910
Inflation Rebounds: ECB's Big Rate Cut Now Unlikely
Carney \considering\ entering race to replace Canada\s Trudeau
High-Potential Investments: Top 10 Stocks to Watch in 2025
US Dollar Insights: Key FX Trends You Need to Know
Why Is Nvidia Making Headlines Everywhere Today?
Discover How Your Trading Personality Shapes Success
FINRA Charges UBS $1.1 Million for a Decade of False Trade Confirmations
Pepperstone Sponsored the "Aston Martin Aramco Formula One Team"
ACY Securities Integrates MetaTrader 5 to Enhnace Copy Trading Service
Currency Calculator


