简体中文
繁體中文
English
Pусский
日本語
ภาษาไทย
Tiếng Việt
Bahasa Indonesia
Español
हिन्दी
Filippiiniläinen
Français
Deutsch
Português
Türkçe
한국어
العربية
3 Sterling (GBP) Pairs Traders Should Watch as Brexit Talks Continue
Abstract:Sterling sentiment has taken another positive shift as Brexit deal negotiations evolve and traders should monitor these three GBP-pairs closely.
GBPAUD, GBPNZD and EURGBP Technical Analysis:
EURGBP breaking lower and threatens a nine-month low.
GBPAUD and GBPNZD retracing recent losses.
We have recently released our Q1 2019 Trading Forecasts for a wide range of Currencies and Commodities, including GBP and EUR along with our latest fundamental and medium-term term technical outlooks.
While the Sterling space is current looking positive, as Brexit talks seemingly steer towards a soft outcome, it should be noted that all the following three GBP-trading pairs are in, or at, overbought or oversold territory (using RSI) and short-term retraces may occur.
Sterling Price Latest: Easing No Deal Brexit Fears Boost British Pound (GBP).
EURGBP Breakdown Eyes Mid-April Low
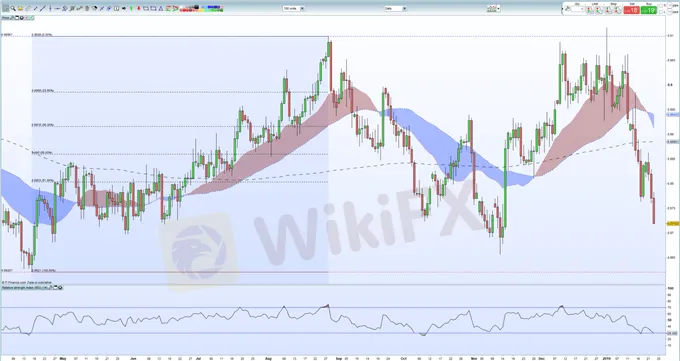
Often seen as the ‘Brexit Barometer’ reflecting the strengths of the two economies, EURGBP has fallen sharply after hitting a 2019 high of 0.90625 on January 11. The fall has taken the pair below all three-moving averages and below the 61.8% Fibonacci retracement level at 0.88030. This technical set-up suggest further falls may be on the cards although the RSI indicator is now indicating that the pair are oversold in the short-term and may retrace before continuing the move lower. To the downside, the November 13 low at 0.86570 may offer support before the mid-April low at 0.86210 comes into view.
EURGBP Daily Price Chart (April 2018 – January 23, 2019)

GBPAUD – Sterling Strength and Aussie Weakness
Another chart that appealsis GBPAUDwhich showshighlights the recent strength of Sterling and weakness of the Australian dollar. The Aussie has been impacted by renewed fears of a slowdown in China and this may well continue with Chinese growth predicted to slow further - and potentially faster than expected - according to the latest IMF Global Growth Outlook.The daily chart shows GBPAUD trading comfortably above all three moving averages and currently touching the January 2 ‘spike-high’ at 1.8285. A break above here would bring into play the old March 2018 swing-high at 1.8509 before the October 9 high at 1.8737. The pair are close to entering overbought territory and may retrace towards support between 1.7870 and 1.7950 if Sterling sentiment changes course.
GBPAUD Daily Price Chart (February 2018 – January 23, 2019)

GBPNZD Re-testing the 200-Day Moving Average
Another GBP-pair that may have further upside potential although price movement is currently blocked by the 200-day moving average around 1.9285. GBPNZD has not traded up the long-term dma since early November 2018 and a clean break and close above may open up further gains. To the upside, 1.9759 offers the first level of horizontal resistance, followed by 2.003 and the October 9 high high print at 2.0481. As with GBPAUD, the pair are showing signs of being overbought. Initial supoort seen between 1.9040 and 1.9060.
GBPNZD Daily Price Chart (February 2018 – January 23, 2019)

IG Client Sentiment for Sterling shows how daily and weekly retail trader holdings can affect market thinking.
Disclaimer:
The views in this article only represent the author's personal views, and do not constitute investment advice on this platform. This platform does not guarantee the accuracy, completeness and timeliness of the information in the article, and will not be liable for any loss caused by the use of or reliance on the information in the article.
WikiFX Broker
Latest News
Why Even the Highly Educated Fall Victim to Investment Scams?
Warning Against Globalmarketsbull & Cryptclubmarket
BSP Shuts Down Uno Forex Over Serious AML Violations
ACY Securities Expands Global Footprint with South Africa Acquisition
Tokyo Police Arrest 4 for Unregistered FX Trading Scheme
Rupee gains against Euro
Axi Bids AUD 52M to Acquire Low-Cost Broker SelfWealth, Outbidding Competitor Bell Financial
Crypto Influencer's Body Found Months After Kidnapping
US Regulators Tighten Oversight on Bank Anti-Money Laundering Efforts
Doo Group Expands Its Operations with CySEC License
Currency Calculator


