简体中文
繁體中文
English
Pусский
日本語
ภาษาไทย
Tiếng Việt
Bahasa Indonesia
Español
हिन्दी
Filippiiniläinen
Français
Deutsch
Português
Türkçe
한국어
العربية
How to Trade with the COT Report
Abstract:Because the COT report is published weekly, its utility as a market sentiment indicator is better suited to longer-term trading. How do you turn all that "huge gigantic gobbled-up block of text" into a sentiment-based indication that will help you grab some pips?
Because the COT report is published weekly, its utility as a market sentiment indicator is better suited to longer-term trading.
How do you turn all that “huge gigantic gobbled-up block of text” into a sentiment-based indication that will help you grab some pips?
Finding extreme net long or net short positions is one approach to use the COT report in your trading.
Finding these holdings could indicate a market reversal is imminent, because if everyone is long a currency, who is left to buy it?
Nobody.
And who is left to sell if everyone is short a currency?
What exactly is it?
It's pretty silent...
Yes, that's correct. NOBODY.
Consider the situation of driving down a road and coming to a complete stop. What happens if you come to a halt?
There isn't any more road ahead of you, so you can't keep on. The only option is to turn around.
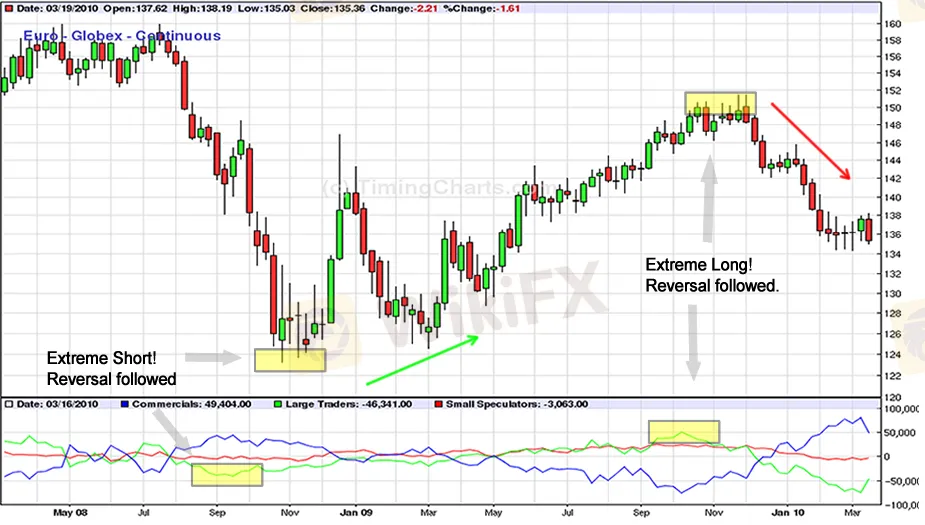
Let's have a look at this EUR/USD chart:

The EUR/USD price activity is taking place in the top part of the chart. Simultaneously, on the bottom side, we have data on long and short EUR futures positions, divided into three categories:
· Traders in goods (blue)
· Large Non-profit organization (green)
· Small, non-commercial businesses (red)
For the time being, disregard the commercial positions, as they are primarily used for hedging, whereas tiny retail traders aren't.
Let's look at what happened in the middle of 2008. As can be seen, the EUR/USD fell steadily from July to September.
EUR/USD fell as the value of non-commercial traders' net short holdings (the green line) fell.
Net short holdings peaked at 45,650 in the middle of September. Investors began buying back EUR futures soon after.
Meanwhile, the EUR/USD exchange rate soared from around 1.2400 to almost 1.4700!
The net value of the EUR futures position gradually improved over the next year. The EUR/USD soon followed suit, even reaching a fresh high near 1.5100.
EUR futures net long positions peaked at 51,000 in early October 2009 before reverting. The EUR/USD continued to fall shortly after that, as well.
Guacamole, guacamole, guacamole! You could have caught two insane moves from October 2008 to January 2009 and November 2009 to March 2010 just by using the COT as an indicator.
The first one took place in mid-September of 2009.
You may have bought EUR/USD at around 1.2300 if you had seen that speculative traders' short holdings were at excessive levels.
In just a few months, this would have resulted in an almost 2,000-pip gain!
If you had also seen that net long positions were at an all-time high in November 2009, you could have sold EUR/USD and made almost 1,500 pips!
You might have made a total of 3,500 pips utilizing the COT report as a market mood reversal indicator with those two moves. Isn't that clever?
Disclaimer:
The views in this article only represent the author's personal views, and do not constitute investment advice on this platform. This platform does not guarantee the accuracy, completeness and timeliness of the information in the article, and will not be liable for any loss caused by the use of or reliance on the information in the article.
WikiFX Broker
Latest News
What is a Stop Out Level?
Challenges of A-Book Execution
Japanese Candlestick Anatomy
What is the difference between support and resistance?
Candlesticks with Support and Resistance
Dual Candlestick Patterns
Basic Japanese Candlestick Patterns
How to Place Your Stop Using Fibonacci to Lose Less Money
What is the Difference Between Double Tops and Double Bottoms?
Bearish and Bullish Pennants and How to Trade Them
Currency Calculator


