简体中文
繁體中文
English
Pусский
日本語
ภาษาไทย
Tiếng Việt
Bahasa Indonesia
Español
हिन्दी
Filippiiniläinen
Français
Deutsch
Português
Türkçe
한국어
العربية
BTC/USD Forex Signal: Recovery Continues Above $42,896
Abstract:Previous BTC/USD Signal My previous signal last Thursday produced a losing short trade from the bearish reversal at the resistance level I had identified at $35,583.
Previous BTC/USD Signal
My previous signal last Thursday produced a losing short trade from the bearish reversal at the resistance level I had identified at $35,583.

Todays BTC/USD Signals
Risk 0.50% per trade.
Trades may be entered before 5pm Tokyo time Thursday.
Long Trade Ideas
Long entry after a bullish price action reversal on the H1 timeframe following the next touch of $42,896, $40,567, or $37,179.
Put the stop loss $100 below the local swing low.
Move the stop loss to break even once the trade is $100 in profit by price.
Remove 50% of the position as profit when the trade is $100 in profit by price and leave the remainder of the position to ride.
Short Trade Ideas
Short entry after a bearish price action reversal on the H1 timeframe following the next touch of $45,668 or $48,555.
Put the stop loss $100 above the local swing high.
Move the stop loss to break even once the trade is $100 in profit by price.
Remove 50% of the position as profit when the trade is $100 in profit by price and leave the remainder of the position to ride.
The best method to identify a classic “price action reversal” is for an hourly candle to close, such as a pin bar, a doji, an outside or even just an engulfing candle with a higher close. You can exploit these levels or zones by watching the price action that occurs at the given levels.
Advertisement
BTC/USD Analysis
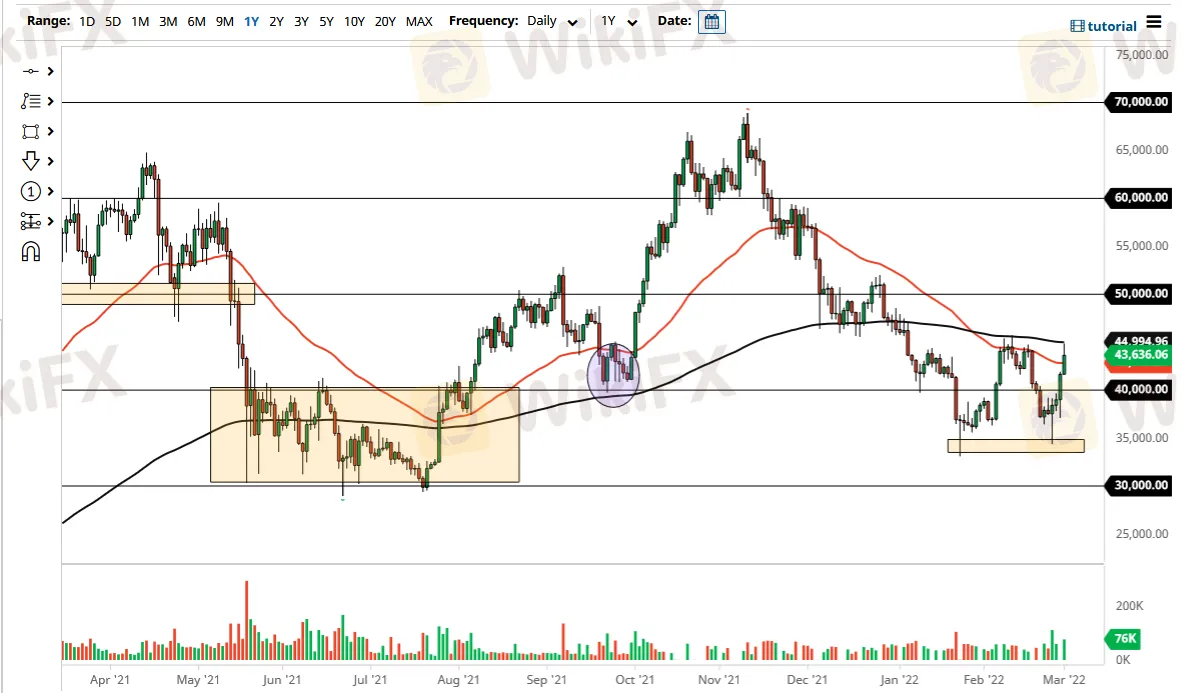
I wrote last Thursday that the price was reaching one-month lows and looked set to continue falling, due to the outbreak of war in Ukraine, until it reached the cluster of very long-term support levels between $30k and $32,817.
This was not a good call as just after I made it the price turned around and has been rising ever since. I thought that the outbreak of war would hurt Bitcoin as a “risky” asset, but the war has instead mostly acted to boost the prices of commodities, especially crude oil, more than anything else.
The price has continued to advance over the past week, especially over the past few days, and now seems to be consolidating above the support at $42,896 and below the resistance at $45,668. The resistance level is very interesting as it has been a very pivotal level since early December 2021 and has been the upper boundary of all price action for the past two months.
The bottom line is that as long as the support level at $42,896 continues to hold and the resistance at $45,668 is not reached, the outlook will remain bullish, but a bearish reversal at $45,668 would be a significant bearish signal and would likely provide a great spot to enter a short swing trade.
If the price gets established above $45,668 that would be a very bullish sign.
Disclaimer:
The views in this article only represent the author's personal views, and do not constitute investment advice on this platform. This platform does not guarantee the accuracy, completeness and timeliness of the information in the article, and will not be liable for any loss caused by the use of or reliance on the information in the article.
WikiFX Broker
Latest News
CySEC Warns Against Unauthorized Investment Firms in Cyprus
Why Even the Highly Educated Fall Victim to Investment Scams?
Warning Against Globalmarketsbull & Cryptclubmarket
Dukascopy Bank Expands Trading Account Base Currencies
UK Sets Stage for Stablecoin Regulation and Staking Exemption
Axi Bids AUD 52M to Acquire Low-Cost Broker SelfWealth, Outbidding Competitor Bell Financial
Crypto Influencer's Body Found Months After Kidnapping
STARTRADER Issues Alerts on Fake Sites and Unauthorized Apps
Italy’s CONSOB Blocks Seven Unregistered Financial Websites
Bitfinex Hacker Ilya Lichtenstein Sentenced to 5 Years in Prison
Currency Calculator


