简体中文
繁體中文
English
Pусский
日本語
ภาษาไทย
Tiếng Việt
Bahasa Indonesia
Español
हिन्दी
Filippiiniläinen
Français
Deutsch
Português
Türkçe
한국어
العربية
Gold Price - Eyes a Fresh One-Month High on Risk-Off Bid
Abstract:The Gold rally off the low seen earlier this month continues unabated, refuelled by growing concerns that the gloomy global economic outlook may last for longer.
Gold Price Analysis and News
Gold pushes higher on risk-off bid.
US dollar remains the best of a bad bunch.
DailyFX Gold Landing Page – Prices, Charts, Analysis and Real-Time News
Gold currently trades either side of $1,317/0z. just off its highest level this month, as equity markets fall on renewed economic growth fears. The risk-off bid has pushed gold into overbought territory (CCI indicator) but any set-backs may well offer a fresh opportunity to re-enter a Gold position, especially if the recent set of higher lows hold.
Fears over an economic slowdown returned at the end of last week with the US Treasury yield curve inverting not just between 2s-10s but also between 3-month T-bills and 10-year Treasurys. Yield curve inversion is seen as a major recessionary warning signal and this will likely spell trouble for the US dollar which is currently trading as the best of a bad bunch, due to its positive yield advantage over most of its peers. The greenback is also benefitting from a raft of bad economic news in the Euro-Zone and the ongoing Brexit malaise in the UK.
The daily Gold chart remains positive but, as pointed out before, is looking overbought in the short-term. The precious metal trades above all three moving averages and comfortably above the 61.8% Fibonacci retracement level at $1,287/oz. There are various near-term support levels all the way back down to the psychological $1,300/oz. level which should likely hold in the current risk-off environment. To the upside, a break above last Thursday‘s $1,320.8/oz. level opens an old $1,326/oz. swing-high ahead of this year’s high print at $1,347/oz.
How to Trade Gold: Top Gold Trading Strategies and Tips.
Gold Chart Daily Time Frame (May 2018 – March 25, 2019)
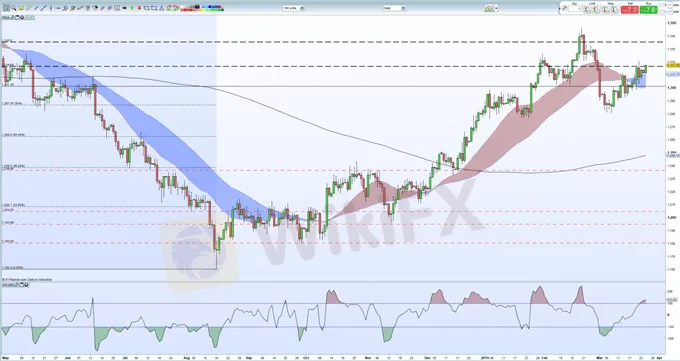
IG Client Sentiment shows that retail traders are 74.2% net-long of Gold, a bearish contrarian indicator. However, recent daily and weekly positional changes suggest a mixed Gold trading bias.
Disclaimer:
The views in this article only represent the author's personal views, and do not constitute investment advice on this platform. This platform does not guarantee the accuracy, completeness and timeliness of the information in the article, and will not be liable for any loss caused by the use of or reliance on the information in the article.
Read more

The U.S. dollar index and U.S. Treasury yields rebounded at the same time; gold fell by more than 1%!
The initial value of the US S&P Global Manufacturing PMI in August was 48, which was lower than expected and the lowest in 8 months; the service PMI was 55.2, which exceeded the expected 54. The number of initial jobless claims in the week ending August 17 was 232,000, slightly higher than expected, and the previous value was revised from 227,000 to 228,000. Existing home sales in July increased for the first time in five months. The PMI data was lower than expected, which was bad for the US eco

The U.S. dollar index returned to the 103 mark; gold once plunged nearly $40 from its intraday high!
The monthly rate of retail sales in the United States in July was 1%, far exceeding expectations; the number of initial claims last week was slightly lower than expected, falling to the lowest level since July; traders cut their expectations of a rate cut by the Federal Reserve, and interest rate futures priced that the Federal Reserve would reduce the rate cut to 93 basis points this year. The probability of a 50 basis point rate cut in September fell to 27%. The data broke the expectation of a

Gold Price Stimulates by Geopolitical Tension
Gold prices experienced their largest gain in three weeks, driven by escalating tensions in the Middle East and the easing of the U.S. dollar as markets await the crucial CPI reading due on Wednesday. Gold has surged to an all-time high above $2,460, as uncertainties surrounding developments in both the Middle East and Eastern Europe persist push the demand for safe-haven assets higher.

KVB Today's Analysis: USD/JPY Eyes Volatility Ahead of BoJ Policy Meeting and US Data
The USD/JPY pair rises to 154.35 during the Asian session as the Yen strengthens against the Dollar for the fourth consecutive session, nearing a 12-week high. This is due to traders unwinding carry trades ahead of the Bank of Japan's expected rate hike and bond purchase tapering. Recent strong US PMI data supports the Federal Reserve's restrictive policy. Investors await US GDP and PCE inflation data, indicating potential volatility ahead of key central bank events.
WikiFX Broker
Latest News
Earn Up to $500 This Halloween with PU Prime’s Copy Trading Promotion
 WikiFX
Vantage's Halloween Promotion
WikiFXUS SEC Approves Options Listing for Three Spot Bitcoin ETFs on NYSE
WikiFXInflation & Deflation Explained
WikiFXKey Angles to Understand for Successful Financial Trading
WikiFXFCA LATEST WARNING
WikiFXPO Trade - A Cautionary Tale of Fraud
WikiFXBinance Connect Update Boosts Fiat-to-Crypto Access for Web3 Firms
WikiFX19-year-old trader’s Experience with a Fraudulent Broker
WikiFXTrapped by Promises: Moroccan Trader Loses Over $10,000 to Zenstox
WikiFXCurrency Calculator

