简体中文
繁體中文
English
Pусский
日本語
ภาษาไทย
Tiếng Việt
Bahasa Indonesia
Español
हिन्दी
Filippiiniläinen
Français
Deutsch
Português
Türkçe
한국어
العربية
KVB Market Analysis | 16 Oct: EUR/USD Falls to Two-Month Lows as USD Strengthens on FOMC Signals
Sommario:Product: XAU/USDPrediction: DecreaseFundamental Analysis:Due to New York state manufacturing activity being much weaker than expected, the 10-year U.S. Treasury yield dropped, helping spot gold to ris
Product: XAU/USD
Prediction: Decrease
Fundamental Analysis:
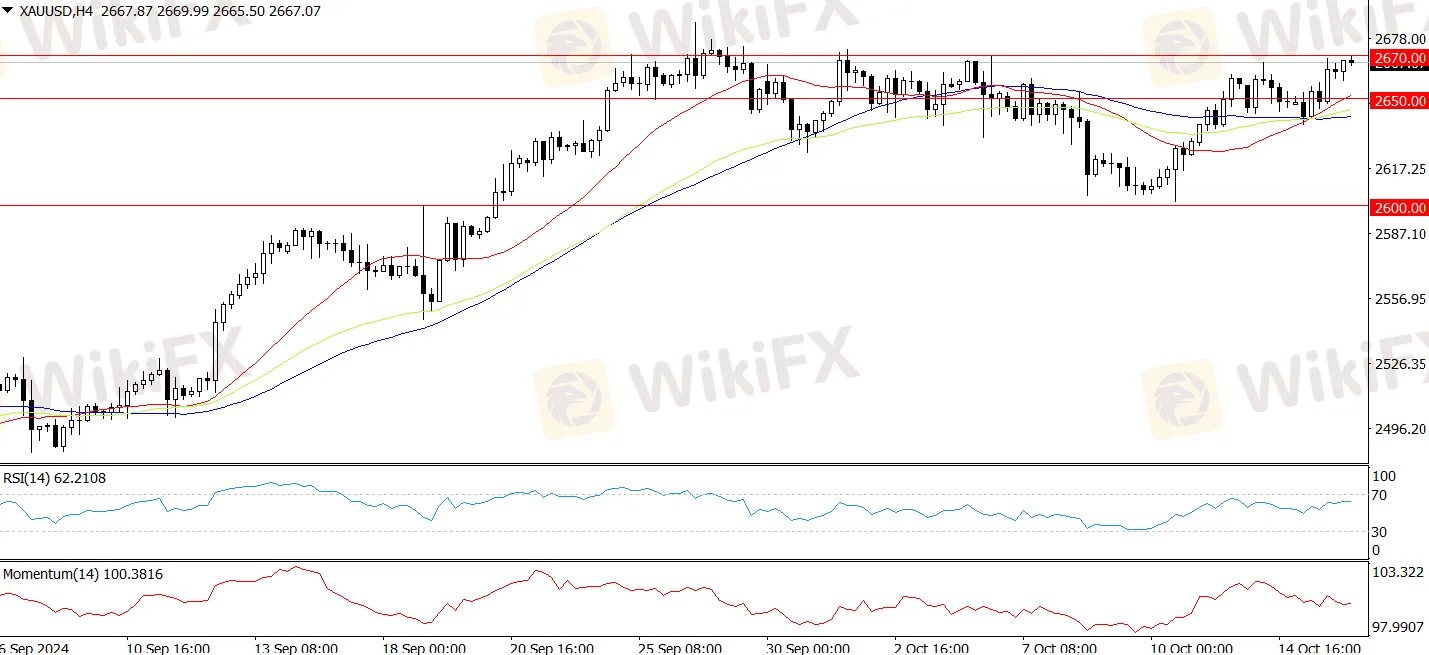
Due to New York state manufacturing activity being much weaker than expected, the 10-year U.S. Treasury yield dropped, helping spot gold to rise by nearly $15 for the day. Lower bond yields make non-interest-bearing gold more attractive. Spot gold closed up $14.10 on Tuesday, a 0.53% gain, at $2662.60/oz, with a high of $2668.95/oz during the day. As U.S. bond yields fell, gold prices climbed, and bond yields also limited the dollar's strength. After rebounding from a low of $2638/oz, gold continued to rise. The U.S. dollar index, tracking the dollar against six currencies, remained steady at 103.25. Bond yield declines provided some stability and support for gold.
Technical Analysis:
After rising above the $2660/oz level, gold's upward trend remains intact. The Relative Strength Index (RSI) is climbing, showing that buyers are still in control. If the price breaks above the October 4 high of $2670/oz, it could pave the way to challenge this year's high at $2685/oz, followed by the $2700/oz level. However, if gold falls below $2650/oz, it may open the door for further declines. The next key support is at $2600/oz, and if that is broken, gold could aim for the 50-day Simple Moving Average (SMA) at $2555/oz.

Product: EUR/USD
Prediction: Increase
Fundamental Analysis:
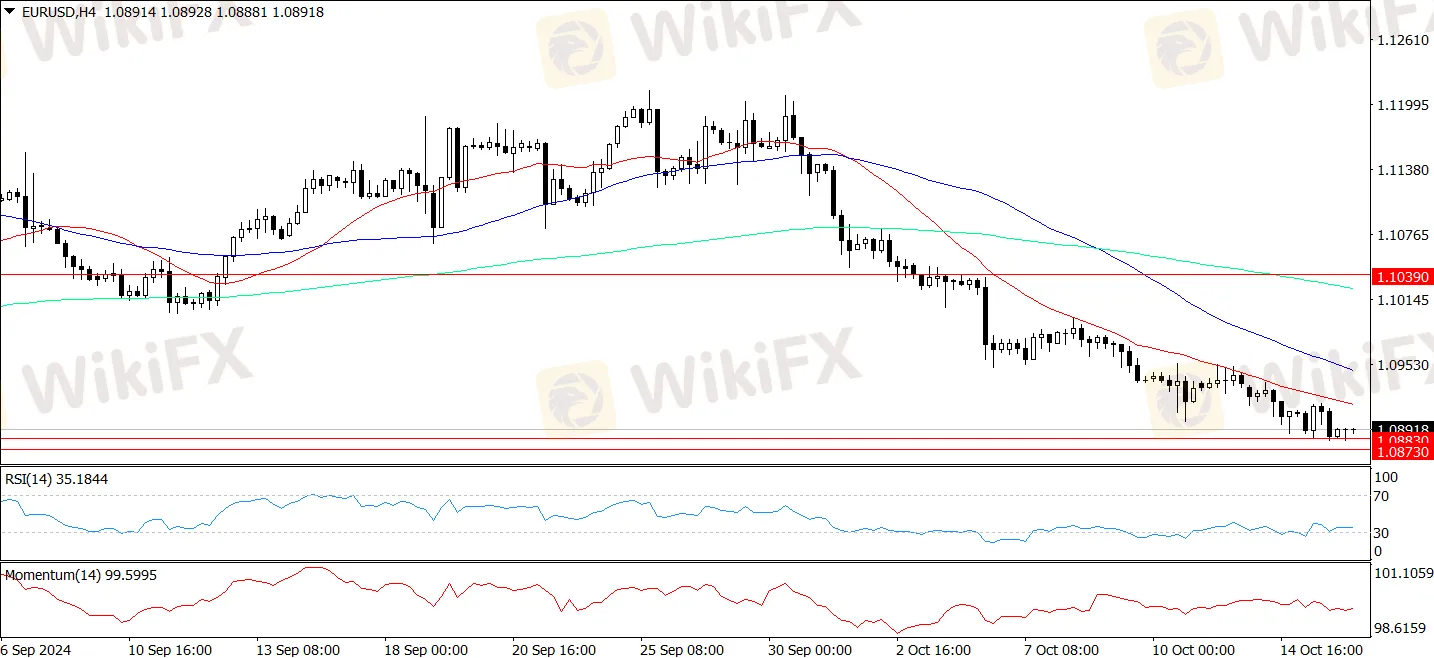
EUR/USD continued to fall on Tuesday, reaching new two-month lows near 1.0880, close to the important 200-day Simple Moving Average (SMA). At the same time, the US Dollar (USD) gained strength, pushing the US Dollar Index (DXY) above 103.00, staying near multi-week highs. The USDs recent rally was supported by the minutes from the Federal Open Market Committee (FOMC) meeting on September 18. The minutes showed that most policymakers were in favor of a 50-basis-point rate cut, but did not commit to a specific timeline for future reductions.
Technical Analysis:
Further declines in EUR/USD may push the pair towards the October low of $1.0883, close to the weekly low of $1.0881 from August 8. On the upside, the 55-day Simple Moving Average (SMA) at $1.1039 could act as a short-term resistance, followed by the 2024 high of $1.1214 and the 2023 top of $1.1275. If EUR/USD breaks below the key 200-day SMA at $1.0873, a more bearish outlook may develop. The four-hour chart shows a weakening trend, with support around 1.0883 and resistance near the 55-SMA at 1.0960. The relative strength index (RSI) has fallen to around 33.

Product: BTC/USD
Prediction: Decrease
Fundamental Analysis:
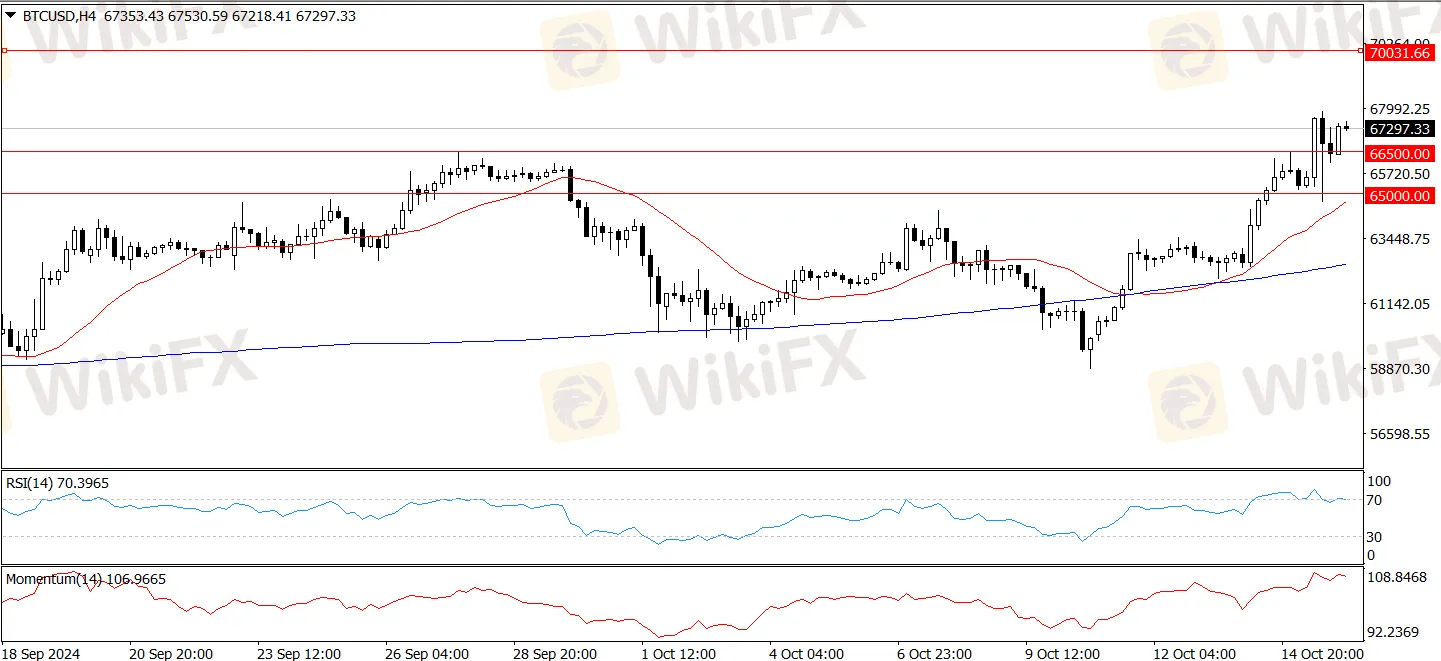
After Bitcoin failed to break through the key resistance level of $68,000, the crypto market saw intense action with both long and short positions getting liquidated. Bitcoin then bounced back to $67,300 for a breather. Billionaire Elon Musk‘s Tesla transferred $770 million worth of Bitcoin to several new addresses, causing panic among sellers. Meanwhile, World Liberty Financial (WLFI), a token tied to Donald Trump’s family, officially went on sale, boosting his November election odds to 57.5%. Additionally, Musk's SpaceX holds 8,285 Bitcoins, according to BitcoinTreasuries. Trump's odds are rising, while Vice President Kamala Harris's chances dropped to 42.1%.
Technical Analysis:
Since 2016, Bitcoin has always seen a rise in noticeable demand before significant price increases. The current demand level is similar to what was seen in February 2024, after which Bitcoin hit an all-time high of $73,800 in March. On-chain researcher Axel Adler Jr. pointed out a similar trend among investors. He noted, “New investors' demand for buying tokens has picked up, growing by 3% over the past 10 days, which is a positive sign for the market.” While Bitcoin's spot demand has improved recently, the recent price rally was mainly driven by the derivatives market. Last week, Bitcoins open interest increased by $800 million over the weekend, pushing prices to $64,500. However, as the week progressed, prices quickly reversed and dipped below $60,000.

Disclaimer:
Le opinioni di questo articolo rappresentano solo le opinioni personali dell’autore e non costituiscono consulenza in materia di investimenti per questa piattaforma. La piattaforma non garantisce l’accuratezza, la completezza e la tempestività delle informazioni relative all’articolo, né è responsabile delle perdite causate dall’uso o dall’affidamento delle informazioni relative all’articolo.
WikiFX Trader
Octa
FxPro
FXTM
FBS
FP Markets
Pepperstone
Octa
FxPro
FXTM
FBS
FP Markets
Pepperstone
WikiFX Trader
Octa
FxPro
FXTM
FBS
FP Markets
Pepperstone
Octa
FxPro
FXTM
FBS
FP Markets
Pepperstone
Rate Calc


