简体中文
繁體中文
English
Pусский
日本語
ภาษาไทย
Tiếng Việt
Bahasa Indonesia
Español
हिन्दी
Filippiiniläinen
Français
Deutsch
Português
Türkçe
한국어
العربية
GBP/NZD’s Divergence Near A Resistance Zone
Abstract:The April and May months have been good for the pound, which recovered a bit from its post-Ukraine war selloff and boosted by the Bank of England’s (BOE) interest rate increases.
GBP/NZD cant seem to get past the 1.9650 zone!
Will the pair get rejected and see bearish pressure at the level?
Here‘s what I’m looking at today:
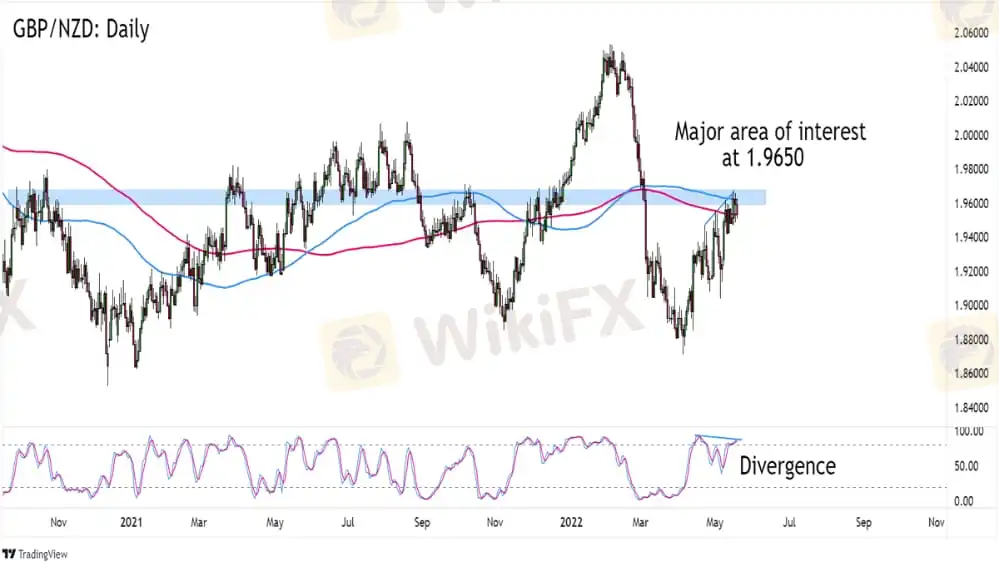
GBP/NZD: DailyThe April and May months have been good for the pound, which recovered a bit from its post-Ukraine war selloff and boosted by the Bank of Englands (BOE) interest rate increases.
GBP/NZD is hitting a ceiling at 1.9650, however.
As you can see, the level is near the 100 and 200 SMAs on the daily time frame. More importantly, GBP/NZD bulls and bears have been minding the area since October 2020.
Will the level hold as resistance this time?
The odds are slightly in the bears‘ favor after the U.K.’s inflation rate hit a 40-year high as food and energy prices rocketed.
And while a lot of major economies are experiencing notable inflation rates, it doesnt help the pound that talks of the BOE ending its interest rate increases are hitting the markets.
Meanwhile, the Reserve Bank of New Zealand (RBNZ) will publish its monetary policy decision next week. Word around is that the central bank will raise its cash rate by as much as 50 basis points to fight inflation.
The diverging monetary policy directions can weigh on GBP/NZD, which is already seeing a bearish divergence in the daily time frame.

Look out for rejection at the 1.9650 zone that can drag GBP to previous areas of interest like 1.9325 or even the 1.8900 lows.
If youre not confident about shorting at current levels, you can also jump in only after seeing a bearish momentum.
Not sure where to place your entry and exit levels? Take a look at GBP/NZDs average volatility for clues.
If you want to know more information about the reliability of certain
brokers, you can open our website (https://www.WikiFX.com/en). Or you
can download the WikiFX APP for free through this link
(https://www.wikifx.com/en/download.html). Running well in both the
Android system and the IOS system, the WikiFX APP offers you the easiest
and most convenient way to seek the brokers you are curious about.

Disclaimer:
The views in this article only represent the author's personal views, and do not constitute investment advice on this platform. This platform does not guarantee the accuracy, completeness and timeliness of the information in the article, and will not be liable for any loss caused by the use of or reliance on the information in the article.
Read more

Ringgit Retreats Against US Dollar Amid Profit-Taking
The Malaysian ringgit saw a slight retreat against the US dollar on Thursday, pulling back from its recent rally as investors cashed in profits following its substantial appreciation.

Ringgit Surges Past RM4.14 Against USD
The Malaysian ringgit continued its upward trajectory against the US dollar at the market's opening today, breaking past the RM4.14 level for the first time since November 2021.

How Does RSI Divergence Work in Trading: Top Cases
The Relative Strength Index, short for RSI, is primarily used to evaluate the strength of bullish and bearish forces and measure the momentum of price changes in terms of speed and magnitude.

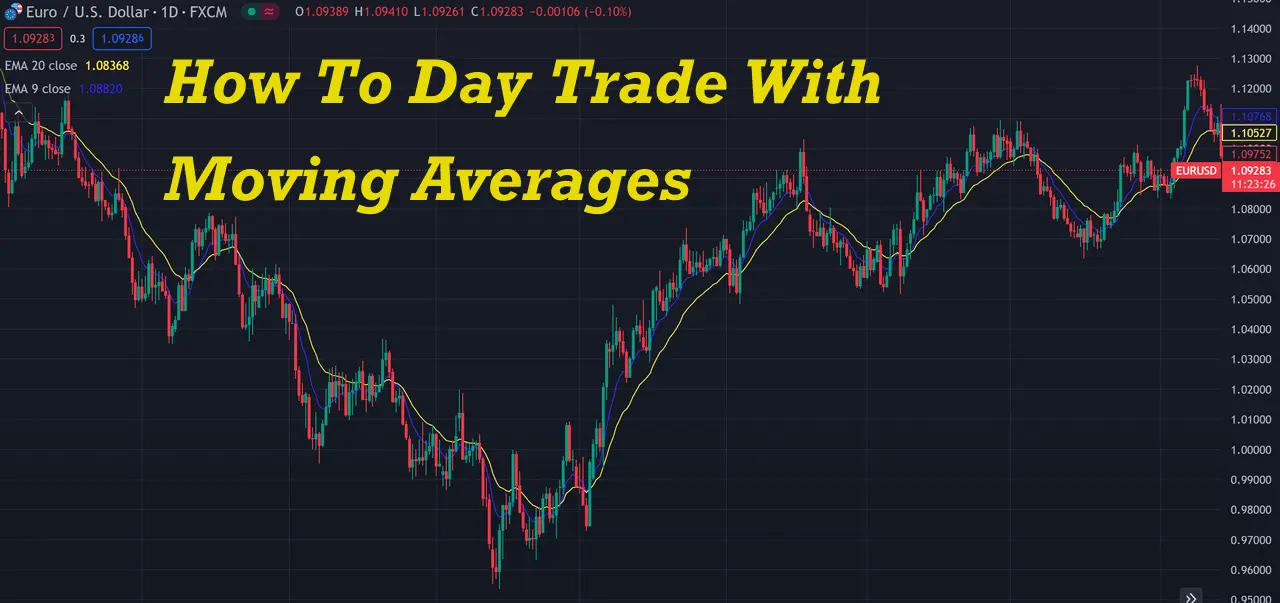
How To Day Trade With Moving Averages
Every successful day trader adheres to a set of strictly followed trading systems and commonly used technical indicators, and moving averages remain a popular choice due to its user-friendly nature and high practicality. By using moving averages, traders can smooth out time fluctuations and more easily identify the future price trend, thus, featuring a higher rate of successful day trading.
WikiFX Broker
Latest News
Geopolitical Events: What They Are & Their Impact?
Volkswagen agrees deal to avoid Germany plant closures
Top 10 Trading Indicators Every Forex Trader Should Know
TradingView Launches Liquidity Analysis Tool DEX Screener
MultiBank Group Wins Big at Traders Fair Hong Kong 2024
WikiEXPO Global Expert Interview: Simone Martin—— Exploring Financial Regulation Change
'Young investors make investment decisions impulsively to keep up with current trends' FCA Reveals
Why Do You Feel Scared During Trade Execution?
CySEC Settles Compliance Case with Fxview Operator Charlgate Ltd
Malaysian Influencer Detained in Taiwan Over Alleged Role in Fraud Scheme
Currency Calculator


