简体中文
繁體中文
English
Pусский
日本語
ภาษาไทย
Tiếng Việt
Bahasa Indonesia
Español
हिन्दी
Filippiiniläinen
Français
Deutsch
Português
Türkçe
한국어
العربية
WTI Crude Oil Forecast: Crude Oil Pulls Back to Test Support
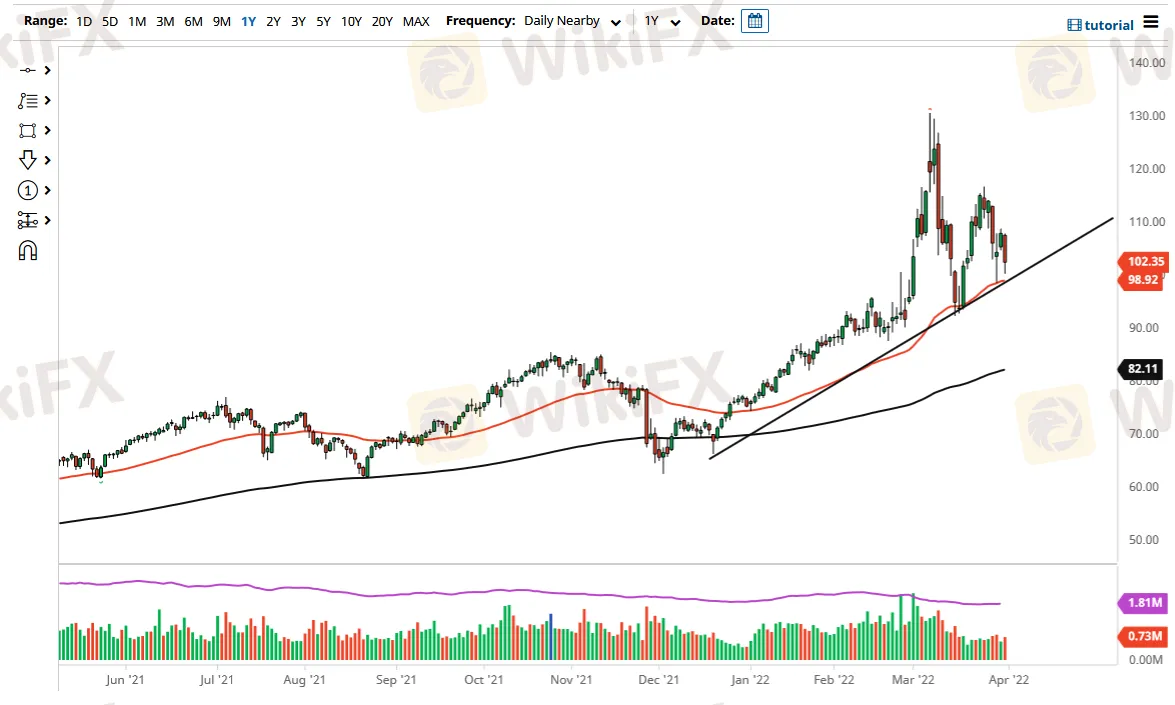
Abstract:The West Texas Intermediate Crude Oil market has fallen a bit during the trading session on Thursday to test a major support area. The support area features not only the $100 level, but also the 50 Day EMA, and the uptrend line that has been so clearly important over the last several months. This is a market that has been very bullish for some time and now looks as if it is trying to reassert that upward pressure.
The West Texas Intermediate Crude Oil market has fallen a bit during the trading session on Thursday to test a major support area. The support area features not only the $100 level, but also the 50 Day EMA, and the uptrend line that has been so clearly important over the last several months. This is a market that has been very bullish for some time and now looks as if it is trying to reassert that upward pressure.
The size of the candlestick is rather impressive, but we are still above the top of a supportive-looking candlestick from Tuesday that had proven itself to be so important. By doing so, the market looks as if it is trying to hang on to this area overall. However, the crude oil market has a lot going on at the moment, with volatility readings much higher than historical norms. Keep an eye on the OVX, which is essentially the “VIX for oil”, as it is still extraordinarily elevated. As long that is going to be the case, it is going to be difficult to keep the uptrend intact for a clean move.

Having said that, it is also worth noting that the market has to deal with the idea of the Biden administration releasing the Strategic Petroleum Reserve to beat the pricing back down. There are murmurs of the possibility that the United States will release 1 million barrels per day. While that could put a little bit of downward pressure on the market, the reality is that the United States uses 21 million barrels.
The size of the candlestick is rather negative, but if we can break above the highs of both the Thursday and Wednesday candlesticks, then it is very likely that oil goes looking towards the $115 level. However, we are getting rather close to the possibility of a breakdown. If we get a daily close below the 50 Day EMA, it is possible that the market drops to the $90 level. This could be due to the idea that inflation and a global slowdown are starting to work against the idea of higher pricing. While supply is an issue, if demand suddenly shrinks, that could be the end of it. Either way, we have a clear area of demarcation just below to pay attention to.
Disclaimer:
The views in this article only represent the author's personal views, and do not constitute investment advice on this platform. This platform does not guarantee the accuracy, completeness and timeliness of the information in the article, and will not be liable for any loss caused by the use of or reliance on the information in the article.
WikiFX Broker
Latest News
Attention! Goldman Sachs Cuts Gold Target to $2910
Inflation Rebounds: ECB's Big Rate Cut Now Unlikely
Carney \considering\ entering race to replace Canada\s Trudeau
High-Potential Investments: Top 10 Stocks to Watch in 2025
US Dollar Insights: Key FX Trends You Need to Know
Why Is Nvidia Making Headlines Everywhere Today?
Discover How Your Trading Personality Shapes Success
FINRA Charges UBS $1.1 Million for a Decade of False Trade Confirmations
Pepperstone Sponsored the "Aston Martin Aramco Formula One Team"
ACY Securities Integrates MetaTrader 5 to Enhnace Copy Trading Service
Currency Calculator


