简体中文
繁體中文
English
Pусский
日本語
ภาษาไทย
Tiếng Việt
Bahasa Indonesia
Español
हिन्दी
Filippiiniläinen
Français
Deutsch
Português
Türkçe
한국어
العربية
Bitcoin Price Analysis: BTC/USD sellers approach $36,300 on Russia-Ukraine crisis
Abstract:However, 50-SMA‘s downside break of the 200-SMA, known as a bear cross, joins the downbeat RSI line and bearish MACD signals to hint at the crypto major’s further downside.

BTC/USD stays pressured around short-term key support after three-week downtrend.
Bear cross, downbeat oscillators keep sellers hopeful around 61.8% Fibonacci retracement level.
Five-week-old ascending trend line support may test the bears nearby horizontal line.
Russian nuclear arsenal on high alert even as Kyiv-Moscow agrees for peace talks.
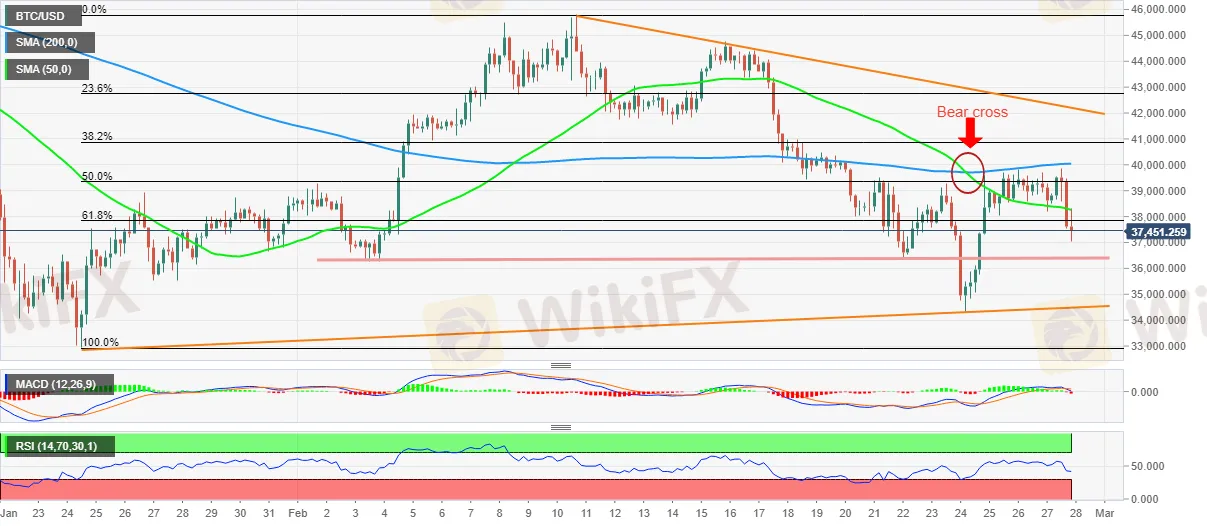
BTC/USD seesaws around $36,700 during the late Sundays trading, after declining for three consecutive weeks in the last.
In doing so, the Bitcoin pair makes rounds to the 61.8% Fibonacci retracement (Fibo.) of the quotes upside from late January to February 10.
That said, three-week-old horizontal support around $36,300 may restrict the BTC/USD pairs immediate downside ahead of an upward sloping trend line from January 24, near $34,500 by the press time.
Following that, the late January low near $32,950 will be in focus.
Alternatively, recovery moves need to provide a decisive break above the 200-SMA level of $40,043 to push back the short-term sellers.
Even so, BTC/USD bulls will remain cautious until the pair stays below a descending trend line from February 10, close to $42,000 by the press time.
Read: Risk-off start to week: Russia's Putin puts nuclear deterrence forces on high alert
BTC/USD: Four-hour chart

Disclaimer:
The views in this article only represent the author's personal views, and do not constitute investment advice on this platform. This platform does not guarantee the accuracy, completeness and timeliness of the information in the article, and will not be liable for any loss caused by the use of or reliance on the information in the article.
Read more

Will the Euro and US Dollar Reach Parity in 2025?
Euro-dollar parity sparks debate again as 2025 approaches, with multiple factors shaping the exchange rate outlook.

US Dollar Surge Dominates Forex Market
The global forex market continues to show volatility, with the U.S. dollar fluctuating last week but overall maintaining a strong upward trend. How long can this momentum last?

Oil Prices Soar for 5 Days: How Long Will It Last?
Last week, the global oil market saw a strong performance, with Brent crude and WTI crude prices rising by 2.4% and around 5% respectively. Oil prices have now posted five consecutive days of gains. But how long can this rally last?

How Big is the Impact of the USD-JPY Rate Gap on the Yen?
The U.S. Federal Reserve's repeated rate cuts and the narrowing of the U.S.-Japan interest rate differential are now in sight. So, why is the U.S.-Japan interest rate differential so important for the yen’s safe-haven appeal, especially when global economic uncertainty rises?
WikiFX Broker
Latest News
Good News Malaysia: Ready for 5% GDP Growth in 2025!
How to Automate Forex and Crypto Trading for Better Profits
Is the stronger dollar a threat to oil prices?
Rising Risk of Japan Intervening in the Yen's Exchange Rate
Standard Chartered Secures EU Crypto License in Luxembourg
How Far Will the Bond Market Decline?
U.S. to Auction $6.5 Billion in Bitcoin in 2025
Trading Lessons Inspired by Squid Game
Is Infinox a Safe Broker?
How Did the Dollar Become the "Dominant Currency"?
Currency Calculator


