简体中文
繁體中文
English
Pусский
日本語
ภาษาไทย
Tiếng Việt
Bahasa Indonesia
Español
हिन्दी
Filippiiniläinen
Français
Deutsch
Português
Türkçe
한국어
العربية
Litecoin price can reach $170 if LTC bulls clear this hurdle
Abstract:Litecoin price has seen an impressive run-up over the past four days, pushing it from $106 to $142.
This uptrend can continue if LTC can flip the $137 to $142 supply zone into a demand barrier.
A breakdown of the 50-day SMA at $133 could trigger a crash to $128 or lower.
Litecoin price has witnessed a massive rally over the past week as the crypto markets flip bullish. This sudden optimism is due to the recent uptick in buying pressure seen among BTC holders. LTC, on the other hand, faces a decisive moment that could help it multiply its recent gains.
Litecoin price looks to fulfill its upward potential
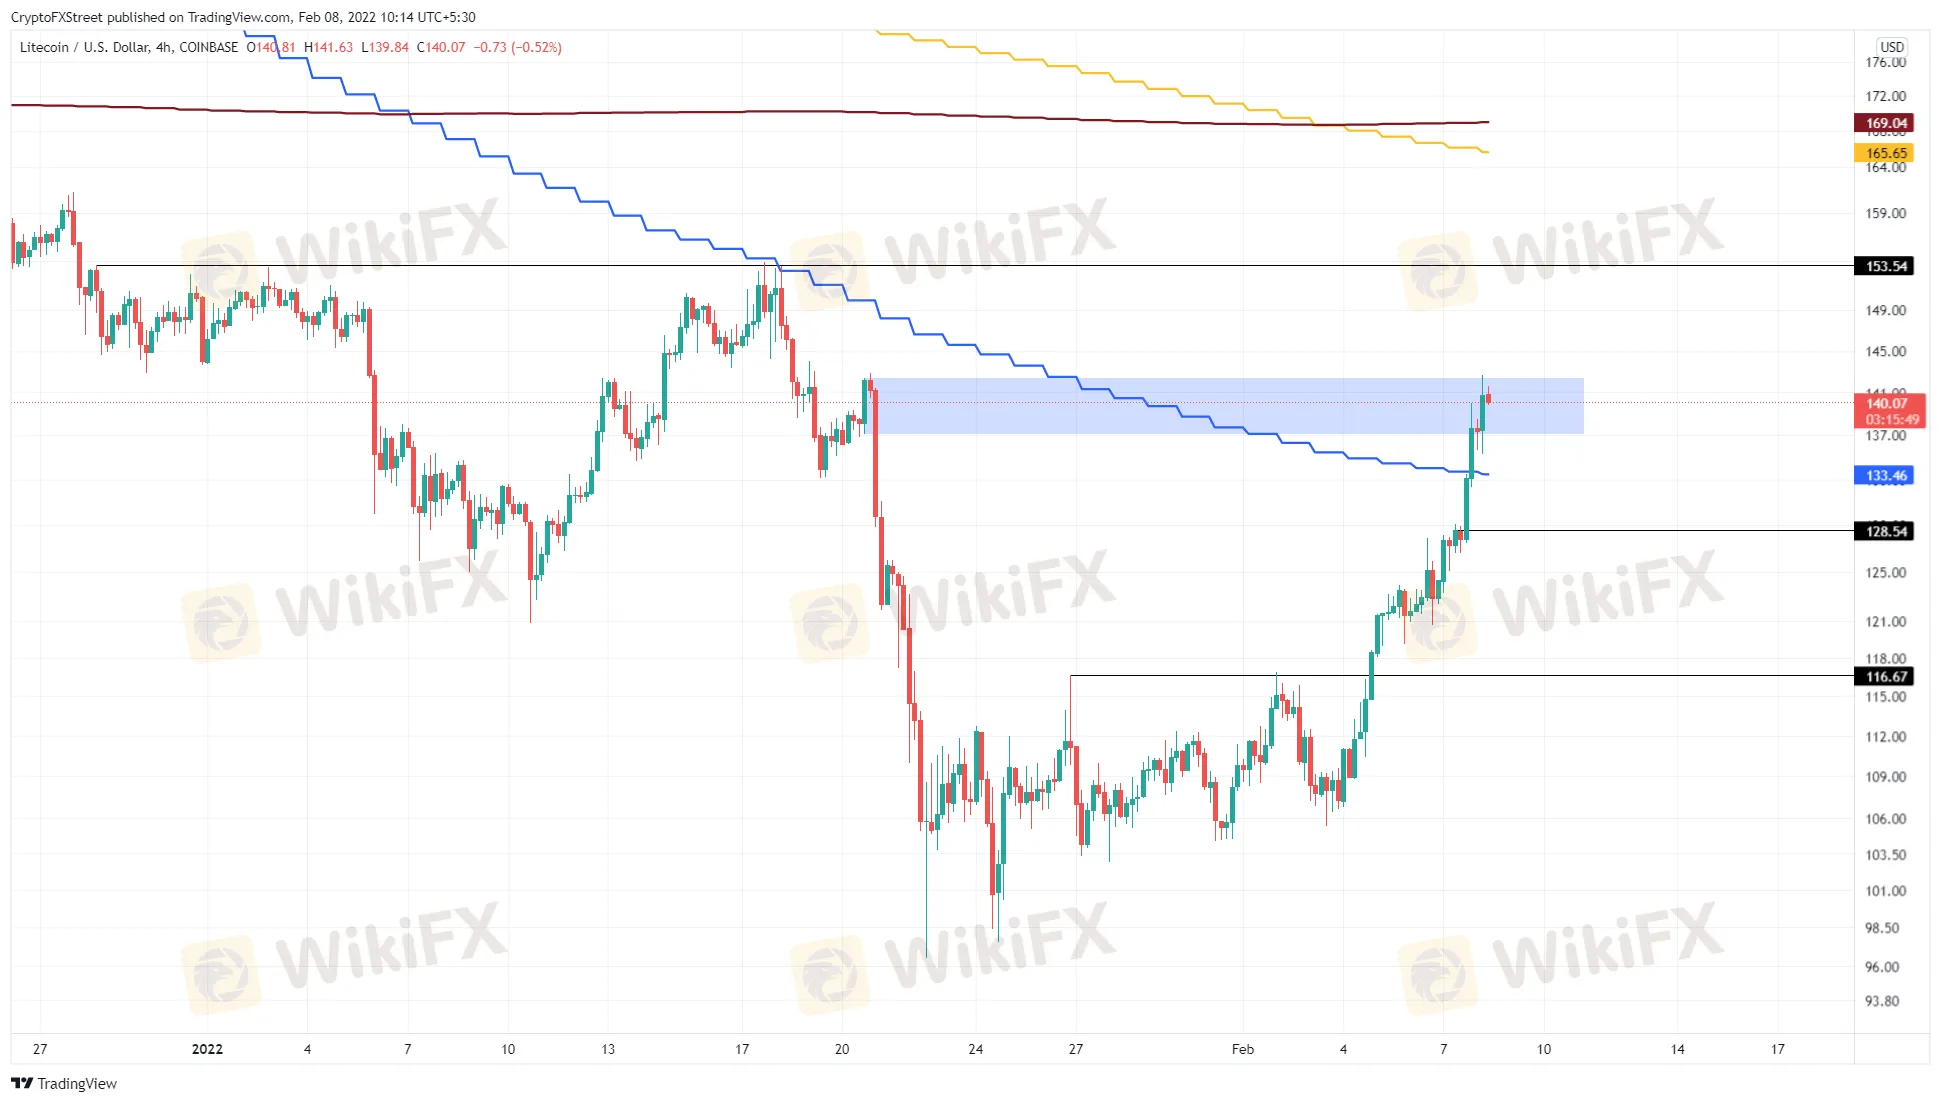
Litecoin price rose a whopping 33% in the last four days, surging from $106 to $142. This uptrend seems to be facing a blockade as it pierced the four-hour supply zone, extending from $137 to $142.
If buyers manage to push LTC higher and produce a four-hour candlestick close above $142, it will flip this hurdle into a foothold. Litecoin needs to form a base before facing a crucial resistance barrier at $153.
Clearing this ceiling is essential for LTC to continue its uptrend. Assuming the bullish momentum flips this resistance barrier into a support floor, investors can expect LTC to embark on another leg-up to $170, coinciding with the 200-day Simple Moving Average (SMA).

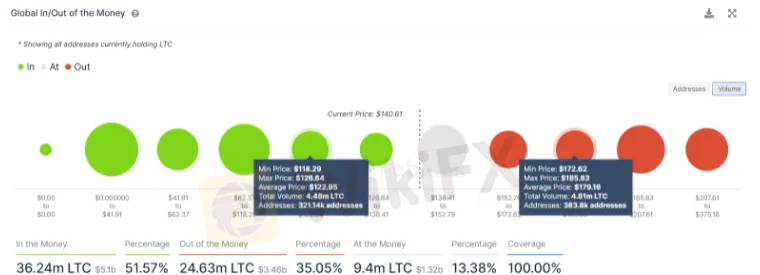
Supporting this resistance sprinkled path for Litecoin price is IntoTheBlocks Global In/Out of the Money (GIOM) model. This on-chain index suggests that LTC will face a hurdle from $172 to $185, where roughly 383,800 addresses that purchased 4.81 million LTC tokens are “Out of the Money.”
Therefore, a move into this territory will likely be met with selling pressure from investors that want to break even. Hence, investors can expect LTC to form a local top around this barrier.

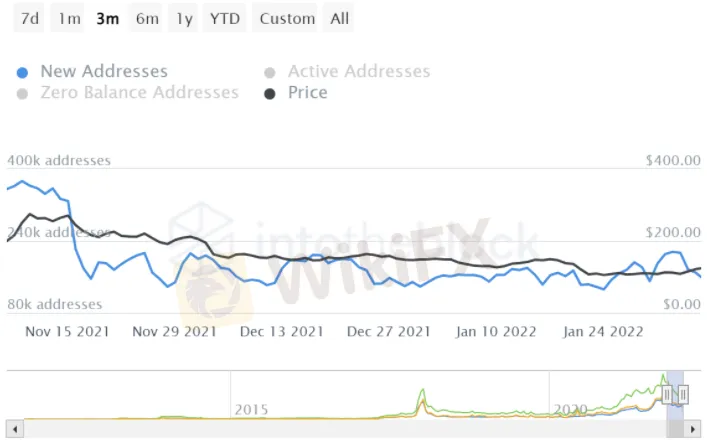
Further depicting the short-term nature of this uptrend is the decline in new addresses joining the LTC network from 355,160 to 169,430 over the past three months. This 52% slump suggests that investors are not interested in LTC at the current price. Therefore, the last leg of this uptrend is likely to be choppy.

On the other hand, if Litecoin price slices through the 50-day SMA at $133, there is good chance profit-taking will push it down to $128. A four-hour candlestick close below this barrier will invalidate the bullish thesis and open the path to $116.

Disclaimer:
The views in this article only represent the author's personal views, and do not constitute investment advice on this platform. This platform does not guarantee the accuracy, completeness and timeliness of the information in the article, and will not be liable for any loss caused by the use of or reliance on the information in the article.
Read more

WikiEXPO 2025 is set to embark on a new global tour
WikiEXPO 2025 is set to embark on a new global tour First station - Hong Kong! Are you ready?

Will the Euro and US Dollar Reach Parity in 2025?
Euro-dollar parity sparks debate again as 2025 approaches, with multiple factors shaping the exchange rate outlook.

US Dollar Surge Dominates Forex Market
The global forex market continues to show volatility, with the U.S. dollar fluctuating last week but overall maintaining a strong upward trend. How long can this momentum last?

Oil Prices Soar for 5 Days: How Long Will It Last?
Last week, the global oil market saw a strong performance, with Brent crude and WTI crude prices rising by 2.4% and around 5% respectively. Oil prices have now posted five consecutive days of gains. But how long can this rally last?
WikiFX Broker
Latest News
90 Days, Rs.1800 Cr. Saved! MHA Reveals
The Yuan’s Struggle: How China Plans to Protect Its Economy
LiteForex Celebrates Its 20th Anniversary with a $1,000,000 Challenge
Misleading Bond Sales Practices: BMO Capital Markets Fined Again by SEC
Italy’s Largest Bank Intesa Sanpaolo Enters Cryptocurrency Market
What Every Trader Must Know in a Turbulent Market
Forex Price Trend Prediction! | Come be a New Year Price Winner!
Forex Brokers vs. Crypto Exchanges: Which Is Safer for Traders?
XTB Secures UAE and Indonesia Licenses, Expands in 2025
In Bursa Malaysia: Local Institutions Sustain Buying Streak & New Subsector Classification
Currency Calculator


