简体中文
繁體中文
English
Pусский
日本語
ภาษาไทย
Tiếng Việt
Bahasa Indonesia
Español
हिन्दी
Filippiiniläinen
Français
Deutsch
Português
Türkçe
한국어
العربية
In forex, candlestick patterns are read.
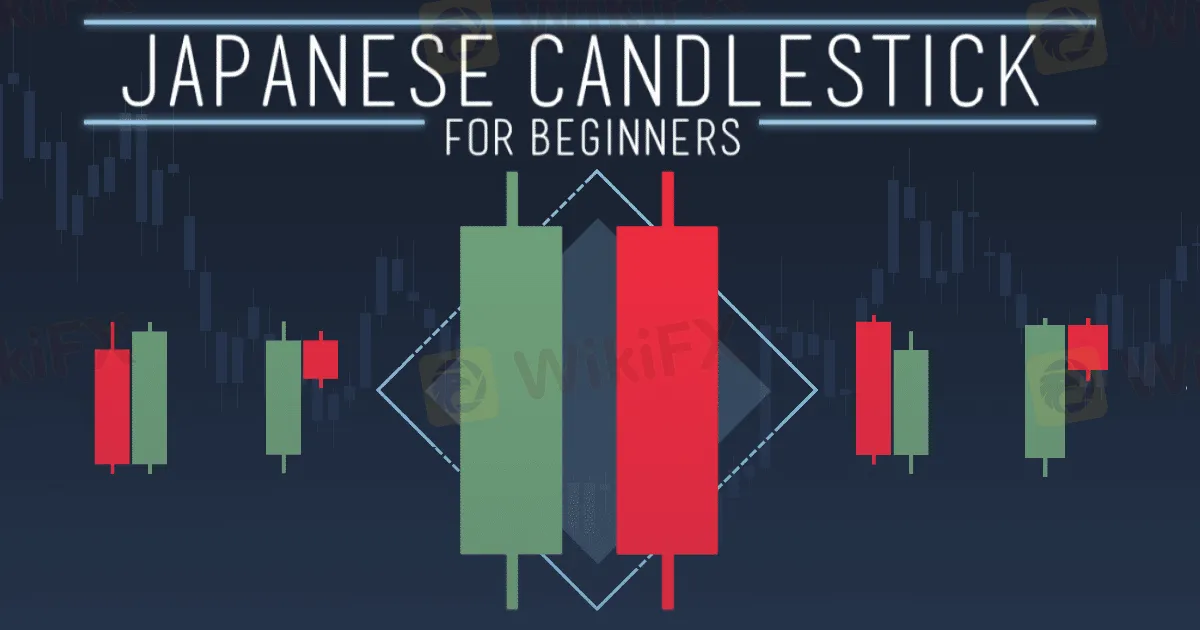
Abstract:What is the meaning of a Japanese candlestick? Japanese candlesticks are just a graphical representation of price variations over time. Traders in Western nations utilized bar charts in the same way, but the Japanese candlestick chart became popular in the 1990s because most traders felt it to be more instructive than the traditional bar chart.

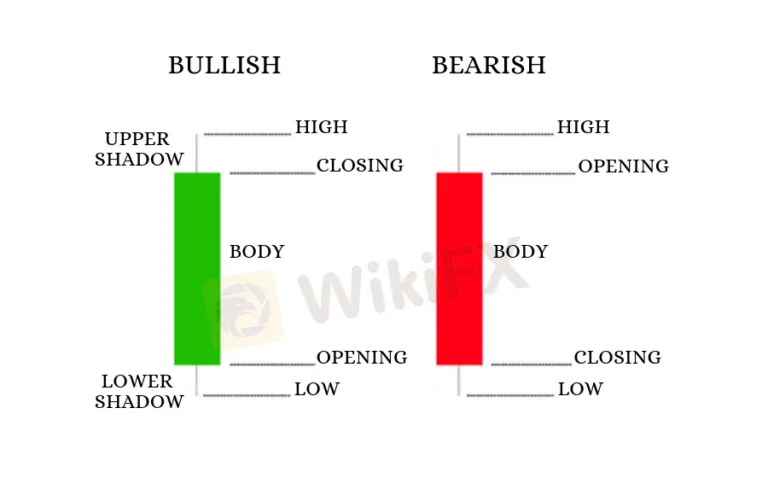
Each Japanese candlestick, like a bar on a price chart, shows price fluctuation over a historical moment in time, depending on the time frame of the price chart on which it appears. Each candlestick on a daily price chart, for example, indicates one day. The open, high, low, and closing prices of each candlestick are used to create it. The “true body” is the space between the open and close that is filled up horizontally with solid color. The candlestick is assigned a bullish hue when the closing is higher than the open (usually green or blue). The candlestick is tinted a bearish color when the closure is lower than the open (usually red).A vertical line continues upward from the genuine body of the candlestick to reach the highest point at which the price traded if the price went higher than the higher of the close or the open during the period when the candlestick was developing. A vertical line continues downward from the bottom of the actual body to the lowest point at which the price traded if the price moved lower than the lower of the close or the open during the period while the candlestick was developing.
With enough practice, you'll be able to see the story told by the movement of the previous ten or twenty candlesticks, which will make your analysis of the most recent one, two, or three candlesticks more powerful, because looking at the longer-term history will give you the context of what's going on now, which can be very helpful in determining whether the time is right to enter a long or short trade.

How to Interpret Candlestick Patterns in the Forex Market
Once you've mastered a few key candlestick patterns, you'll be anxious to apply them to your Forex trading. However, caution is advised because it is all too easy to become obsessed with discovering them and start looking for them everywhere, which may lead to overtrading. The greatest thing you can do is browse back over previous Forex price charts and seek for candlestick patterns that stand out. Could they have made a profitable transaction for you? Is there anything that all good candlestick setups have in common? You'll probably notice that the finest candlestick patterns were enormous, clear, and easy to read. Another crucial point to remember is that candlestick patterns that develop near major support and resistance levels, as well as extreme highs and lows, are far more likely to create profitable trades than patterns that emerge in the middle of nowhere.
The reverse candlestick patterns listed below are all reverse candlestick patterns that may indicate when the price is about to make a dramatic turn. If you can correctly predict these prospective reversals, you'll have entry locations for initiating trades with a favorable, profitable reward-to-risk ratio. These candlestick patterns can be used as continuation indications if they fail to produce a reversal and the price starts to move in the direction of the longer-term trend.
Conclusion
When these Forex candlestick patterns emerge on a live price chart, traders may use them in a variety of ways for trade entrances and exits. Before taking any action, the most conservative approach is to wait until the following candlestick closes. More aggressive traders will enter the trade as soon as the candlestick breaks to the upside or downside, but as you can see from the doji candlestick example above, this will put the trader in a whipsaw position. The trader would have been more certain that the bullish momentum had built up if he had waited till the closure.
Disclaimer:
The views in this article only represent the author's personal views, and do not constitute investment advice on this platform. This platform does not guarantee the accuracy, completeness and timeliness of the information in the article, and will not be liable for any loss caused by the use of or reliance on the information in the article.
Read more

BSP Set to Follow Fed's Rate Cuts to Stabilize PH Peso vs USD
Philippines Central Bank (BSP) is set to follow the Fed's rate cuts to stabilize the PH Peso over USD, maintaining a favorable interest rate spread and supporting the economy.

Philippine Peso Hits 5-Month High in August on Low Inflation
The Philippine peso reached a 5-month high in August, closing at P56.111:$1, driven by lower inflation and regional currency trends.

US-China Deal Enhances Forex Stability and Trading
The recent US-China financial stability agreement enhances forex market stability and trading opportunities by improving transparency and cooperation.

Guide to Trading News Releases & Navigating Market Volatility
Understanding when key news releases occur, identifying the most impactful ones, and effectively trading them while managing risk can set you apart from the competition. This article delves into these aspects, helping you navigate the complexities of trading forex on news releases.
WikiFX Broker
Latest News
CySEC Warns Against Unauthorized Investment Firms in Cyprus
Why Even the Highly Educated Fall Victim to Investment Scams?
Warning Against Globalmarketsbull & Cryptclubmarket
Dukascopy Bank Expands Trading Account Base Currencies
UK Sets Stage for Stablecoin Regulation and Staking Exemption
Axi Bids AUD 52M to Acquire Low-Cost Broker SelfWealth, Outbidding Competitor Bell Financial
Crypto Influencer's Body Found Months After Kidnapping
STARTRADER Issues Alerts on Fake Sites and Unauthorized Apps
Italy’s CONSOB Blocks Seven Unregistered Financial Websites
Bitfinex Hacker Ilya Lichtenstein Sentenced to 5 Years in Prison
Currency Calculator


