简体中文
繁體中文
English
Pусский
日本語
ภาษาไทย
Tiếng Việt
Bahasa Indonesia
Español
हिन्दी
Filippiiniläinen
Français
Deutsch
Português
Türkçe
한국어
العربية
How to Read the Chaikin Volatility Oscillator on Pocket Option?
Abstract:Market volatility is quite an important factor in analysing the behaviour of security prices. The trend changes more often and more rapidly during times of higher volatility.

Market volatility is quite an important factor in analysing the behaviour of security prices. The trend changes more often and more rapidly during times of higher volatility. The changes in the prices are slower and less frequent in periods of lower volatility. These changes affect the readings of indicators as the signals may come too early or too late. This is why it is important to include the volatility factor in the calculations. And today I am going to present the Chaikin Volatility indicator.
Chaikin Volatility basics
The indicator invented by Marc Chaikin is a tool that measures volatility by analysing the gap between the low and high prices of the asset over a specific time. It is known as the Chaikin Volatility indicator (VT).
Adding the Chaikin Volatility to the Pocket Option chart
Log in to your Pocket Option account. Choose the financial instrument you are going to trade during this session. Set the chart period. Click on the Chart Analysis icon and then on the Volatility group of indicators. The Chaikin Volatility will be displayed.
Of course, you may also start typing the name of the indicator needed in the search window.
The VT will appear in the separate window beneath your price chart. It has a form of a line that oscillates around the 0 line.

How the Chaikin Volatility works
The indicator calculates the exponential moving average of the difference in the prices high and low. Then, it measures the change of this moving average over time in a percentage value.
Chaikin advises using a 10-day moving average to review volatility.
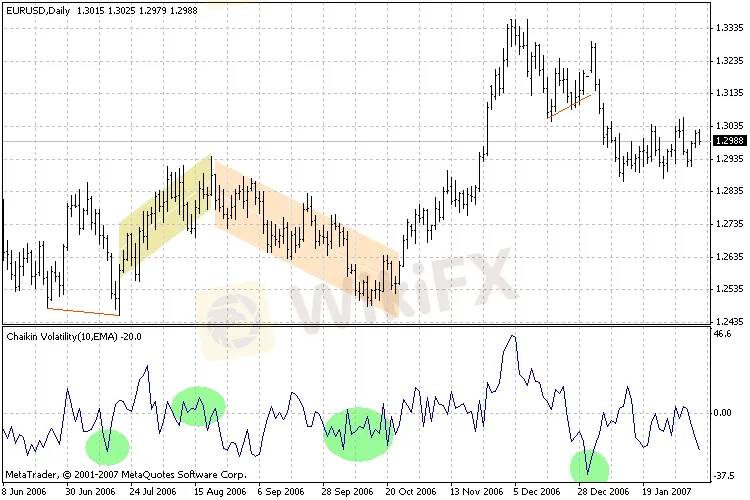
When the indicator shows low values, it means that the intraday prices range from high to low is comparatively constant. When the indicator readings show high values, the intraday prices range from high to low is pretty wide.
The situation when the price creates tops on the price chart and the volatility is increased in a short time indicates the traders get nervous. When the market tops are accompanied by decreasing volatility over a long time, it indicates a growing bull market.

Now, when the price forms bottoms and the volatility decreases over a long time, it suggests the traders do not put much interest in the market.

When volatility increases over a short period of time and there are bottoms in the market, it means traders sell in panic.

Low volatility and its decrease can be observed during the upward movement of the prices.
At the top of the uptrend, prior to a reversal of the trend, a slow increase in volatility can occur.
Higher volatility can be noted during the downward move.
Near the bottom of the downtrend, a short time volatility increase can be seen.
Final words
The Chaikin Volatility indicator measures volatility. The author recommends using a 10-day moving average in calculations.
Head to the Pocket Option demo account and check how the Chaikin Volatility works. This is a free practice account where you can check every new indicator or trading technique. It is supplied with virtual cash that you can power up any time you want. You do not lose your own money even in case of a failing transaction. Train your skills before moving to the real account.
Below, you will find the comments section. Share your thoughts about the Chaikin Volatility indicator with us. I would be glad to hear from you.

Disclaimer:
The views in this article only represent the author's personal views, and do not constitute investment advice on this platform. This platform does not guarantee the accuracy, completeness and timeliness of the information in the article, and will not be liable for any loss caused by the use of or reliance on the information in the article.
Related broker
Read more

New Year, New Surge: Will Oil Prices Keep Rising?
As of the writing of this article (January 2), oil prices stand at $71.88 per barrel. Investors need to continue monitoring whether the supply and demand dynamics will continue to push prices further up.

Bursa Malaysia Dips as Investors Brace for 2025 Uncertainty
Bursa Malaysia saw a slight dip on the final trading day of the year as profit-taking and cautious sentiment dominated. The FBM KLCI declined 3.4 points to 1,634.28, with muted turnover of RM822.07 million due to year-end festivities. Blue-chip stocks, including Tenaga Nasional and Telekom Malaysia, experienced declines, while regional markets remained subdued amid global uncertainties. As 2024 approaches, investors remain cautious, balancing risks with potential opportunities.

Will the Fed Cut Rates in 2025? What to Expect
The Federal Reserve has implemented multiple interest rate cuts in 2024, bringing the rate to a range of 4.25%-4.5% by the end of the year. However, whether the Fed will continue cutting rates or shift to rate hikes in 2025 remains uncertain. The Fed's policy direction depends not only on economic data but also on internal adjustments, the policy direction of the new president, and other factors.

Could the USD Index See Bigger Gains in 2025?
As of December 30, 2024, the US Dollar Index is hovering around a relatively high level of 108. So, can the Dollar Index continue to rise in 2025? Overall, there is still a possibility for the dollar to appreciate, but it also faces several uncertain factors that could affect its trajectory.
WikiFX Broker
Latest News
Will Gold Break $2,625 Amid Fed Caution and Geopolitical Risks?
Vietnamese Police Bust $1.2 Million Crypto Fraud Case
WikiEXPO Global Expert Interview: Loretta Joseph——Unlock the forefront of digital finance
XTB Receives Licenses to Operate in Indonesia & UAE
SEBI Bans Big "Finfluencers for Misleading Investors"
WikiFX New Year Bash: Chance to Win 70 USDT
ECB Targets 2% Inflation as Medium-Term Goal
New Year, New Surge: Will Oil Prices Keep Rising?
WikiFX Review: Is HYCM still reliable in 2024?
Will Gold Shine Brighter in 2025?
Currency Calculator


