简体中文
繁體中文
English
Pусский
日本語
ภาษาไทย
Tiếng Việt
Bahasa Indonesia
Español
हिन्दी
Filippiiniläinen
Français
Deutsch
Português
Türkçe
한국어
العربية
Dogecoin Back To $0.35? Here’s What Needs To Happen
Abstract:For the Dogecoin price to return to last months high of $0.355, it must first overcome this huge technical obstacle.
For the Dogecoin price to return to last months high of $0.355, it must first overcome this huge technical obstacle.
The DOGE token, by its standards, has been extremely quiet so far in November. The meme-coin is changing hands at $0.263 this morning (+1.05%) and down around 6% month-to-date. But whilst the price-action has been muted in November, October was a different story altogether.
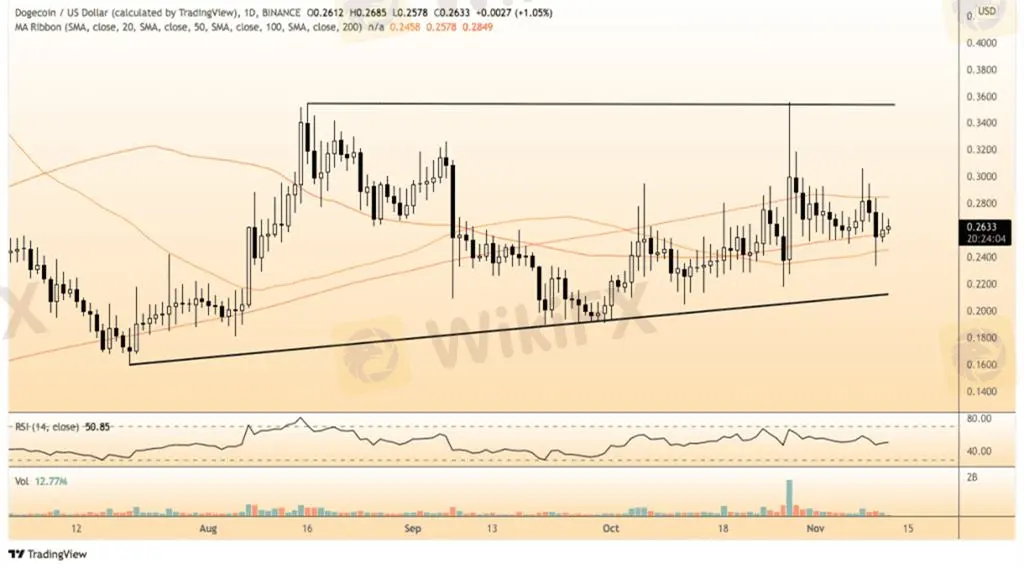
On the 28th, DOGE jumped 26% as profits from Shina Inu (SHIB) rotated back into O.G dog coin. However, the rally hit a brick wall at the August high of $0.355 and was quickly reversed. Since then, the coin has been falling, reaching a low of $0.233 on Wednesday when Bitcoin (BTC) suddenly dropped 9%. Encouragingly, the price has stabilized and shows signs that it could be ready for another run at the $0.355 resistance. However, it will first need to close above the 200-Day Moving Average at $0.284
DOGE price Analysis
The daily chart shows the 28th of October rally was the first time Dogecoin closed above the 200-DMA since September. However, the failure at the August high sent the price tumbling back below the indicator, which is now a significant resistance level. In my opinion, if DOGE clears the 200-DMA on a closing basis, it should extend towards the $0.355 resistance. On the flip side, the longer it remains below the indicator, the higher the odds of a reversal.
Below the market, the 100-DMA at $0.258 is the first support, followed by the 50 at $0.245. I would consider a close below the 50 DMA as a bearish signal, targeting the essential trend-line support at $0.2121. Which, notwithstanding, a crypto market meltdown should hold up.
At the moment, the outlook is undecided, and on that basis, the view is neutral until the price breaches the long-term moving averages. Therefore, traders should pay close attention to the levels above for signs of a breakout.

Disclaimer:
The views in this article only represent the author's personal views, and do not constitute investment advice on this platform. This platform does not guarantee the accuracy, completeness and timeliness of the information in the article, and will not be liable for any loss caused by the use of or reliance on the information in the article.
Read more
WikiFX Broker
Latest News
Think Before You Click: Malaysian Loses RM240,000 to Investment Scam
Lawsuit Filed Against PayPal Over Honey’s Affiliate Fraud
What Are The Top 5 Cryptocurrency Predictions For 2025?
XRP Price Prediction for 2025: Will It Hit $4.30 or More?
Dr. Sandip Ghosh, Ex-RG Kar Principal, Involved in Multi-Crore Scam
OPEC's Profound Influence on the Oil Market
Just2Trade: SAFE or SCAM?
The January Effect of 2025 in Forex Markets
New York becomes first US city with congestion charge
Currency Calculator


