简体中文
繁體中文
English
Pусский
日本語
ภาษาไทย
Tiếng Việt
Bahasa Indonesia
Español
हिन्दी
Filippiiniläinen
Français
Deutsch
Português
Türkçe
한국어
العربية
WTI Crude Oil Forecast: Crude Oil Rolls Over
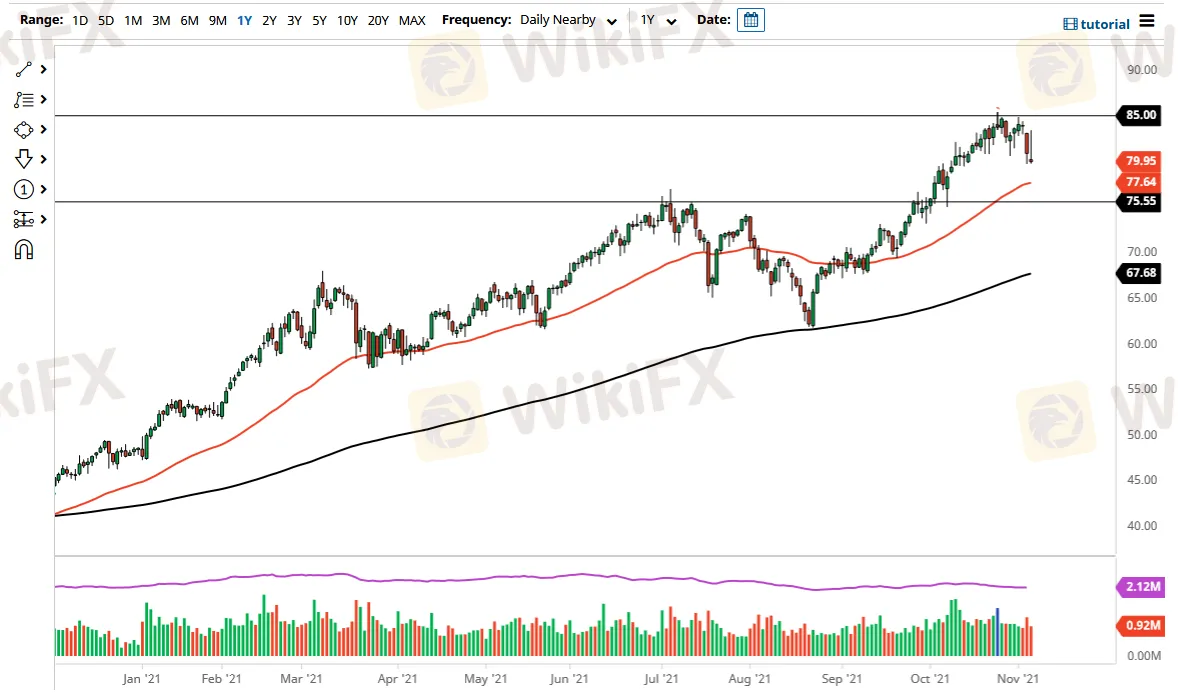
Abstract:The “measured move” of the bullish flag suggests that we could be looking at a move as high as $100, but that is obviously a very long term type of speculation. The West Texas Intermediate Crude Oil market initially shot higher during the trading session, after gapping lower. That being said, we turned around and sold off quite drastically to show signs of exhaustion. It is hard to tell what happens next, but it certainly looks as if it is going to go lower, and therefore we probably need to find some type of value underneath. The fact that we are below the $80 level is quite interesting, and I think a lot of people are going to be paying close attention to this.
The “measured move” of the bullish flag suggests that we could be looking at a move as high as $100, but that is obviously a very long term type of speculation.
The West Texas Intermediate Crude Oil market initially shot higher during the trading session, after gapping lower. That being said, we turned around and sold off quite drastically to show signs of exhaustion. It is hard to tell what happens next, but it certainly looks as if it is going to go lower, and therefore we probably need to find some type of value underneath. The fact that we are below the $80 level is quite interesting, and I think a lot of people are going to be paying close attention to this.
At this point in time, the 50 day EMA sits just below at the $77.62 level, which of course would attract a lot of attention. The $75.50 level offers support as well, as it was a significant resistance barrier. Somewhere between here and one of those levels, it is likely that we will see buyers jumping into this market. After all, the demand for crude oil will continue to go much higher, but it is worth noting that the Kuwaiti Oil Minister suggested that perhaps there would be an oversupply of crude oil in 2022. (The reality is that this is probably more or less an attempt to downplay the idea that US shale is coming back online.) Because of this, I think it is probably only a matter of time before we see this market rally, so I am stepping out of the way and waiting to see signs of support.
If we turn around and break above the top of the candlestick for the session on Thursday, this would obviously be a very bullish sign. You could make an argument that we are forming a little bit of a bullish flag, but really all things been equal, this is a market that has been in a bullish run for so long that a little bit of a pullback certainly makes quite a bit of sense. Because of this, I think it is only a matter of time before we see an attempt to reach even higher. The “measured move” of the bullish flag suggests that we could be looking at a move as high as $100, but that is obviously a very long term type of speculation. Furthermore, if we break down below what could be thought of as the bullish flag, that would negate that projected number.

Disclaimer:
The views in this article only represent the author's personal views, and do not constitute investment advice on this platform. This platform does not guarantee the accuracy, completeness and timeliness of the information in the article, and will not be liable for any loss caused by the use of or reliance on the information in the article.
WikiFX Broker
Latest News
Ghana Trader Jailed for $300K Forex and Crypto Scam
US Dollar Surge Dominates Forex Market
Hong Kong Police Bust Deepfake Crypto Scam Syndicate Involving $34 Million
Is it a good time to buy Korean Won with the current depreciation?
Pepperstone Sponsored the "Aston Martin Aramco Formula One Team"
ACY Securities Integrates MetaTrader 5 to Enhnace Copy Trading Service
Soegee Futures Review: Should You Trust This Broker?
Malaysian Pilot Loses RM1.36 Million in UVKXE Investment App Scam
Indonesia officially joins the BRICS countries
Attention! Goldman Sachs Cuts Gold Target to $2910
Currency Calculator


