简体中文
繁體中文
English
Pусский
日本語
ภาษาไทย
Tiếng Việt
Bahasa Indonesia
Español
हिन्दी
Filippiiniläinen
Français
Deutsch
Português
Türkçe
한국어
العربية
Top 10 Candlestick Patterns To Trade the Markets
Abstract:Top 10 Candlestick Patterns To Trade the Markets
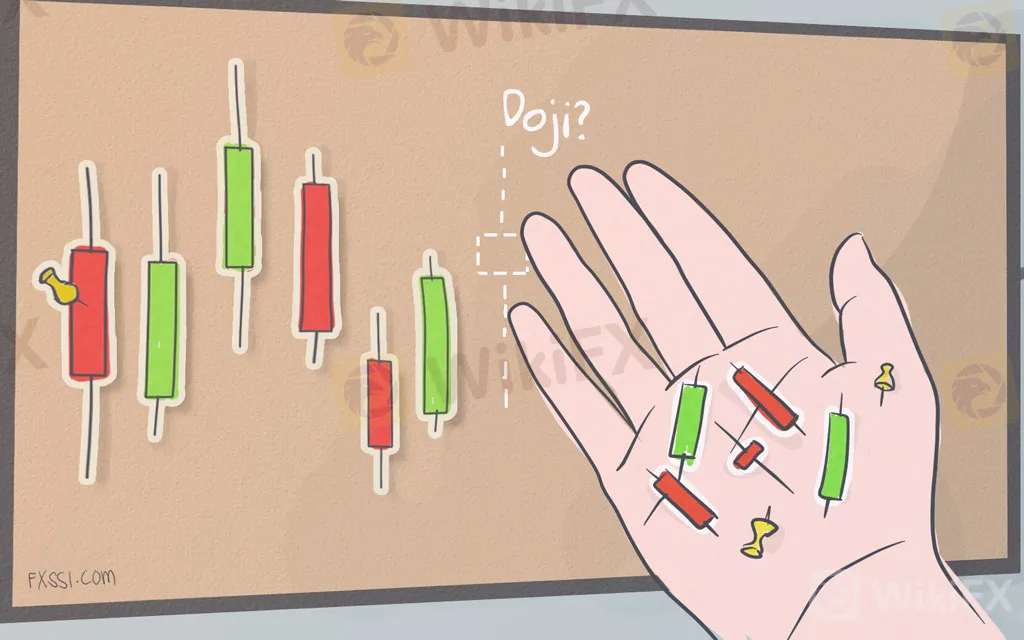
Candlestick patterns are important tools in technical trading. Understanding them allows traders to interpret possible market trends and form decisions from those inferences. There are various types of candlestick patterns which can signal bullish or bearish movements. This article will briefly touch upon what candlestick patterns are and introduce the top 10 formations all traders should know to trade the markets with ease.
WHAT ARE CANDLESTICK PATTERNS?
A candlestick is a single bar which represents the price movement of a particular asset for a specific time period. The information it displays includes the open, high, low and close for that time period.
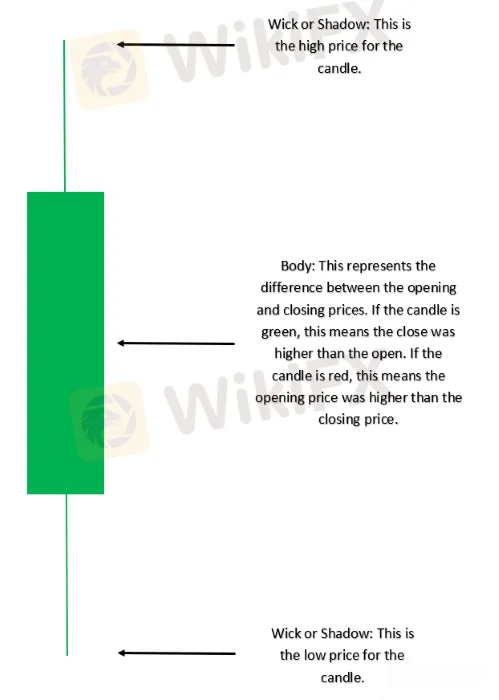
Candlestick patterns take into account one or more candlesticks to assist technical traders in developing inferences about future movements and price patterns of the underlying asset. These are displayed graphically on a chart, which is utilized for market analysis. Our guide to reading candlestick charts is a great place to start to learn how to interpret candlesticks for trading.
CANDLESTICK PATTERNS CAN BE BULLISH OR BEARISH
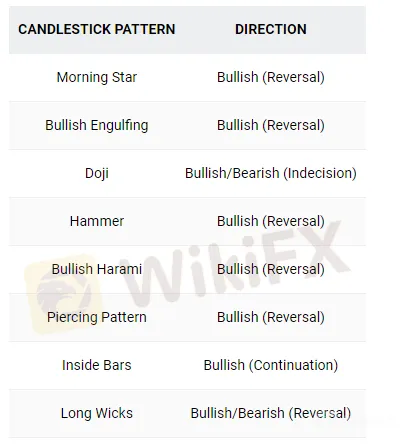
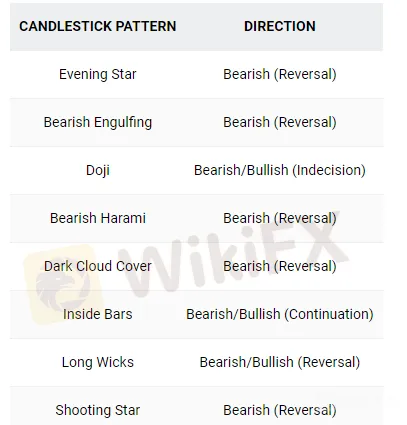
In order to recognize and apply the most commonly used candlestick patterns to a trading strategy, traders need to understand how the inclination of these patterns can affect the market direction (trend). The tables below summarize the two main categories of price movement that candlesticks can indicate. Many of these patterns are featured in our top 10 list below.
Bullish Candlestick Patterns:
Bearish Candlestick Patterns:
TOP 10 CANDLESTICK PATTERNS TRADERS SHOULD KNOW
1 - EVENING STAR AND MORNING STAR
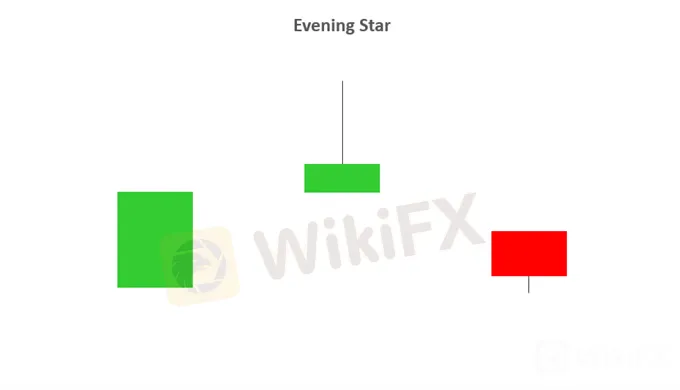
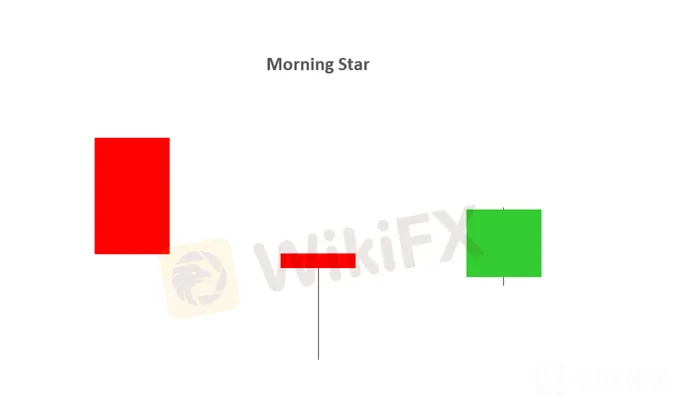
The evening and morning star candlestick patterns occur at the end of upwards/downward trends respectively and tend to indicate reversal patterns.
The names come from the star shaped formation of the arrangement.
As you can see from the image below, the first candlestick is in the direction of the trend, followed by a bullish or bearish candle with a small body. The third candlestick is seen in the direction of the reversal, ideally closing passed the halfway point of the first candlestick.
Trading this candlestick pattern will require a confirmation candle in the direction of the respective reversal – for example, traders will look for a bearish candle after the evening star.
2 - BULLISH & BEARISH ENGULFING
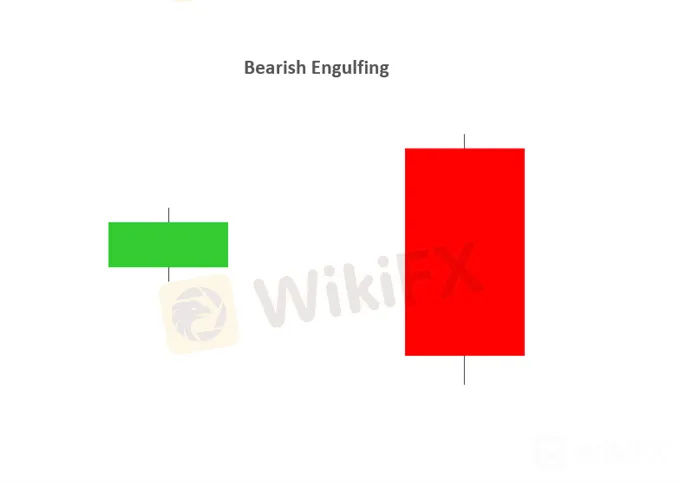
A bullish or bearish engulfing candlestick pattern may indicate reversal patterns.
A bullish engulfing candlestick formation shows bulls outweigh bears. As the pattern below shows, the green body (bulls) covers completely the first candlestick (bears).
A bearish engulfing candlestick pattern is small green (or bullish) candle followed by a larger red (bearish) candle immersing the small green candle.

3 – DOJI
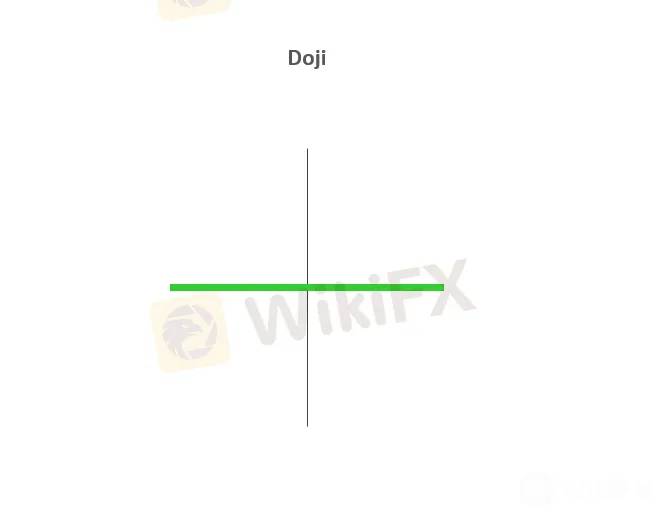
The Doji candlestick chart pattern is associated with indecision in the market of the underlying asset. This could mean potential reversal of the current trend or consolidation.
This pattern can occur at the top of an uptrend, bottom of a downtrend, or in the middle of a trend.
The candlestick itself has an extremely small body centered between a long upper and lower wick.
4 – HAMMER
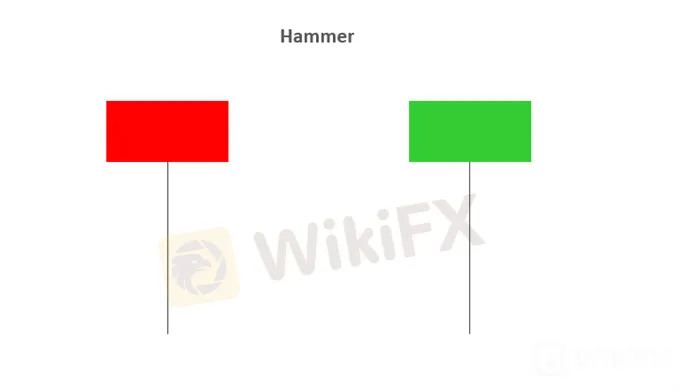
The Hammer candle is viewed as a bullish reversal usually occurring at the bottom of a downward trend.
This candle formation includes a small body whereby the open, high, low and close are roughly the same. There is a long lower wick beneath the body which should be more than twice the length of the candle body. The body may be bullish or bearish, however bullish is considered more favorable.
5 – BULLISH & BEARISH HARAMI
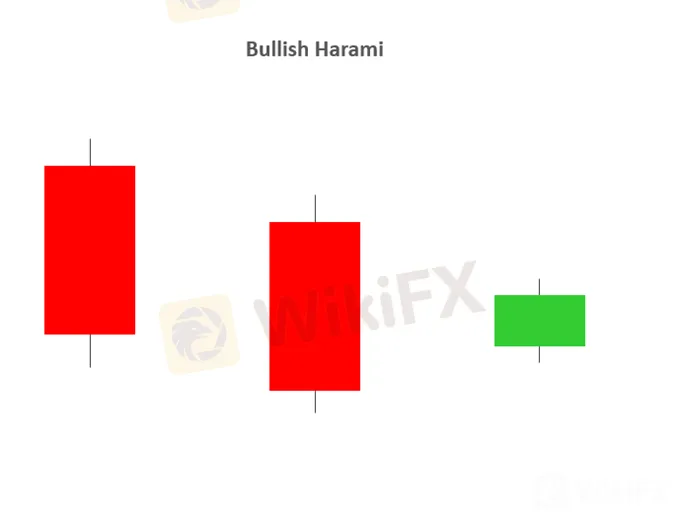
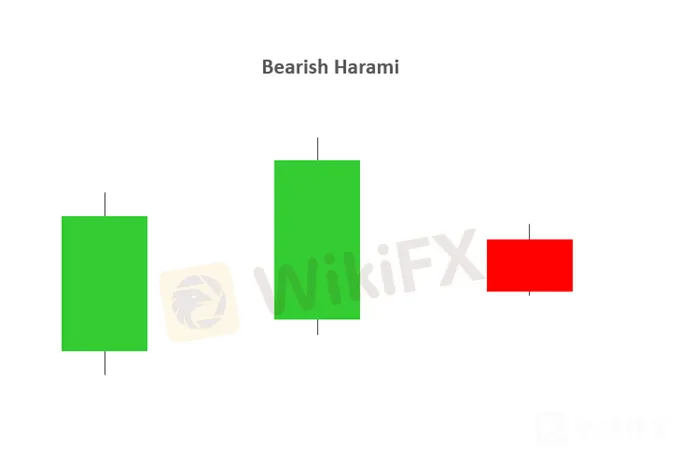
A Bullish or Bearish Harami may indicate reversal patterns.
The word “Harami” means “pregnant” in Japanese, and the name has been given to this candlestick pattern because it resembles a pregnant woman. The second candle in the pattern must be contained within the body of the first candle as seen in the images below. This holds true for both bullish and bearish Haramis.
A downtrend precedes a bullish Harami and an uptrend precedes that of a bearish Harami.
6 – DARK CLOUD COVER
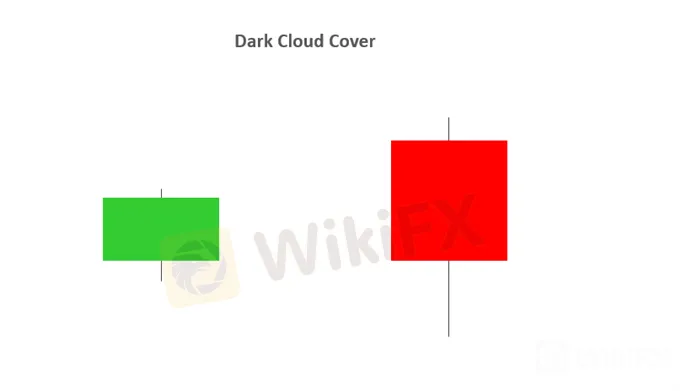
The Dark Cloud Cover pattern is seen as a bearish reversal pattern.
This candlestick pattern must occur during an uptrend. As seen in the image below, the bullish candle is followed by a bearish candle.
This bearish candle must confirm certain criteria to validate the Dark Cloud Cover pattern:
1. The opening price must by higher than the previous days close.
2. The closing price must close below the midpoint of the previous bullish candle.
The Dark Cloud Cover pattern looks similar to that of the Bearish Engulfing pattern. The difference between the two relates to the second candlestick. Bearish Engulfing pattern has the second candlestick opening above the close of the first, whilst the Dark Cloud Cover opens above the high of the first candle and closes below the midpoint of the first candlestick body.
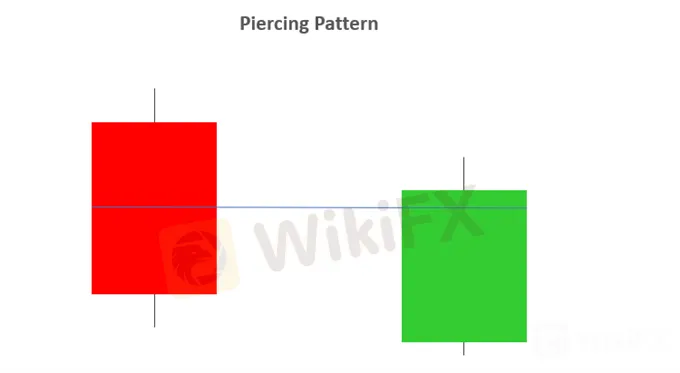
7 – PIERCING PATTERN
The Piercing Pattern is viewed as a bullish candlestick reversal pattern, at the end of a downtrend or during a pullback within an uptrend, or at the support.
There are two components of a Piercing Pattern formation:
1. Bearish candle
2. Bullish candle
A Piercing Pattern occurs when a bullish candle (second) closes above the middle of bearish candle (first) in a downward trending market.
The open price of the second candle should gap down at market open and ensue by closing above the mid-point of the previous candle as indicated below.
Both the Piercing and Dark Cloud Cover patterns have similar characteristics. The difference is that the piercing line is a bullish reversal pattern as mentioned above, whilst the Dark Cloud Cover pattern is a bearish reversal pattern.
8 – INSIDE BARS
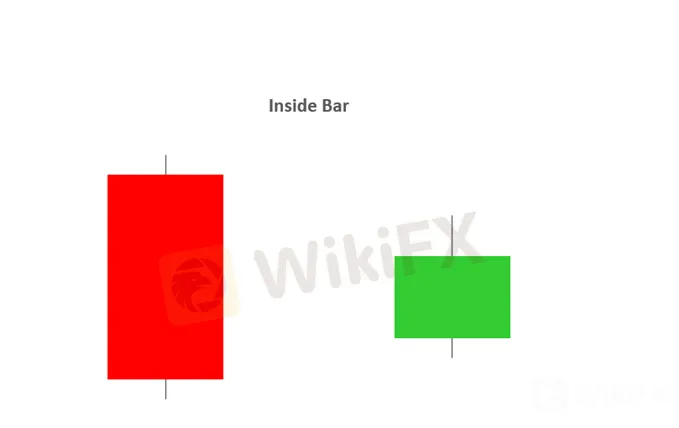
The Inside Bar pattern is utilized in trending markets whereby the high and low of the Inside bar is within the parameters of the previous candle or “mother bar”.
Inside Bars are traded within the direction of the trend – if the market is in a downtrend, the trader would look to continue with a short position with the presence of an Inside Bar. The same principal is applied in an uptrend.
Trading in the direction of the trend is not always a given as key levels of support/resistance can indicate a reversal. Classically, the entry points for traders is positioned above or below the high or low of the mother bar depending on the direction of the trade.
An inside bar is also similar to a bullish or a bearish harami candlestick pattern. The main difference being that with an inside bar, the highs and lows are considered while the real body is ignored.
9 – LONG WICKS
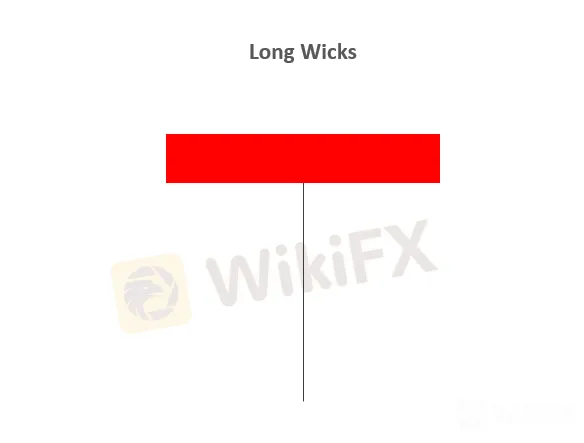
Long Wicks candlestick patterns often indicate a reversal in the trend.
Long Wicks occur when prices are tested and then rejected. The wick indicates rejected prices.
Identifying the trend is important to interpret the significance of the Long Wick.
Identifying key levels and price action is often used in conjunction with Long Wick patterns.
10 – SHOOTING STAR
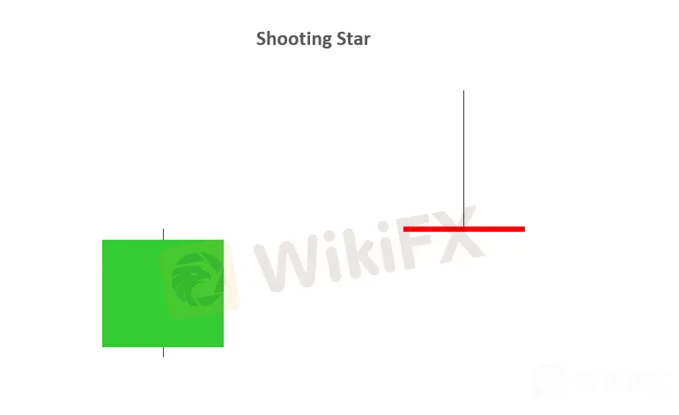
A Shooting Staris a bearish candle with a long upper wick, little or no lower wick and a small real body near the day's low. It comes after an uptrend, and potentially indicates a trend reversal to the downside.
The distance between the high and opening price of the candle must be more than twice as large as the Shooting Star's body. The distance between the lowest price for the day and the closing price must be very small or nonexistent.
----------------
WikiFX, the world's No.1 broker inquiry platform!
Use WikiFX to get free trading strategies, scam alerts, and experts experience!
Android : cutt.ly/Bkn0jKJ
iOS : cutt.ly/ekn0yOC

Disclaimer:
The views in this article only represent the author's personal views, and do not constitute investment advice on this platform. This platform does not guarantee the accuracy, completeness and timeliness of the information in the article, and will not be liable for any loss caused by the use of or reliance on the information in the article.
Read more

Easy Trading Online Awarded “Best Forex Broker - Asia” at Wiki Finance EXPO 2024 Hong Kong
We are thrilled to announce that Easy Trading Online has been awarded the “Best Forex Broker - Asia” at the Wiki Finance EXPO 2024 Hong Kong! This prestigious recognition underscores our commitment to excellence and dedication to providing top-notch services to our clients.

Celebrating Excellence of Easy Trading Online at 2024 FastBull Awards Ceremony
On the evening of April 28, Easy Trading Online proudly received the 'Most Trusted Forex Broker' award at the BrokersView 2024, hosted by Fastbull. This accolade is a testament to our steadfast dedication to providing reliable and superior trading services in the forex and CFD brokerage industry.

Easy Trading Online Shines as Gold Sponsor at BrokersView Expo Dubai 2024
The BrokersView Expo Dubai 2024 is a premier event in the financial industry, bringing together top financial institutions, brokers, and technology providers from around the globe. As the Gold Sponsor of BrokersView Expo Dubai 2024, Easy Trading Online took the opportunity to showcase our latest products, service technologies, and core competitive advantages in the forex trading field.

Easy Trading Online at the Wiki Gala Night
On the 23rd of March, the Easy Trading Online family had the distinguished pleasure of being the Table Sponsor at the prestigious Wiki Gala Night. As we reflect on the event, it’s with a sense of pride and joy that we share the highlights and our takeaways from an evening that was as inspiring as it was splendid.
WikiFX Broker
Latest News
CFI Partners with MI Cape Town, Cricket Team
Doo Financial Expands Reach with Indonesian Regulatory Licenses
Volkswagen agrees deal to avoid Germany plant closures
Geopolitical Events: What They Are & Their Impact?
Webull Canada Expands Options Trading to TFSAs and RRSPs
CySEC Launches Redesigned Website Packed with New Features
WikiFX Review: Is PU Prime a decent broker?
TradingView Launches Liquidity Analysis Tool DEX Screener
MultiBank Group Wins Big at Traders Fair Hong Kong 2024
WikiEXPO Global Expert Interview: Simone Martin—— Exploring Financial Regulation Change
Currency Calculator


