简体中文
繁體中文
English
Pусский
日本語
ภาษาไทย
Tiếng Việt
Bahasa Indonesia
Español
हिन्दी
Filippiiniläinen
Français
Deutsch
Português
Türkçe
한국어
العربية
Stock Market Has Almost Always Ignored the Economy
Abstract:There has never been a reliable relationship between equities and GDP or the broader political or social environment.
The U.S. stock market is fiddling while America burns, or so it seems to a lot of people.
The S&P 500 Index has surged 45% since it last bottomed on March 23 through Monday, based on closing prices. It‘s up 8% since protests began on May 27 in response to the death of George Floyd in police custody in Minneapolis. And it’s just 5% off its Feb. 19 record high — less if you include dividends. Meanwhile, the U.S. economy is beset by a continuing coronavirus shutdown and widespread social unrest. Against that backdrop, the markets relentless march higher seems delusional to many.
But the stock market is not a barometer of the country‘s health — politically, socially or even economically. Its sole function, as wonky as it may sound, is to quickly, accurately and unemotionally tabulate investors’ consensus view about the health and prospects of publicly traded companies. In that regard, the market has ably done its job throughout this crisis, regardless of opinions about the outcome.
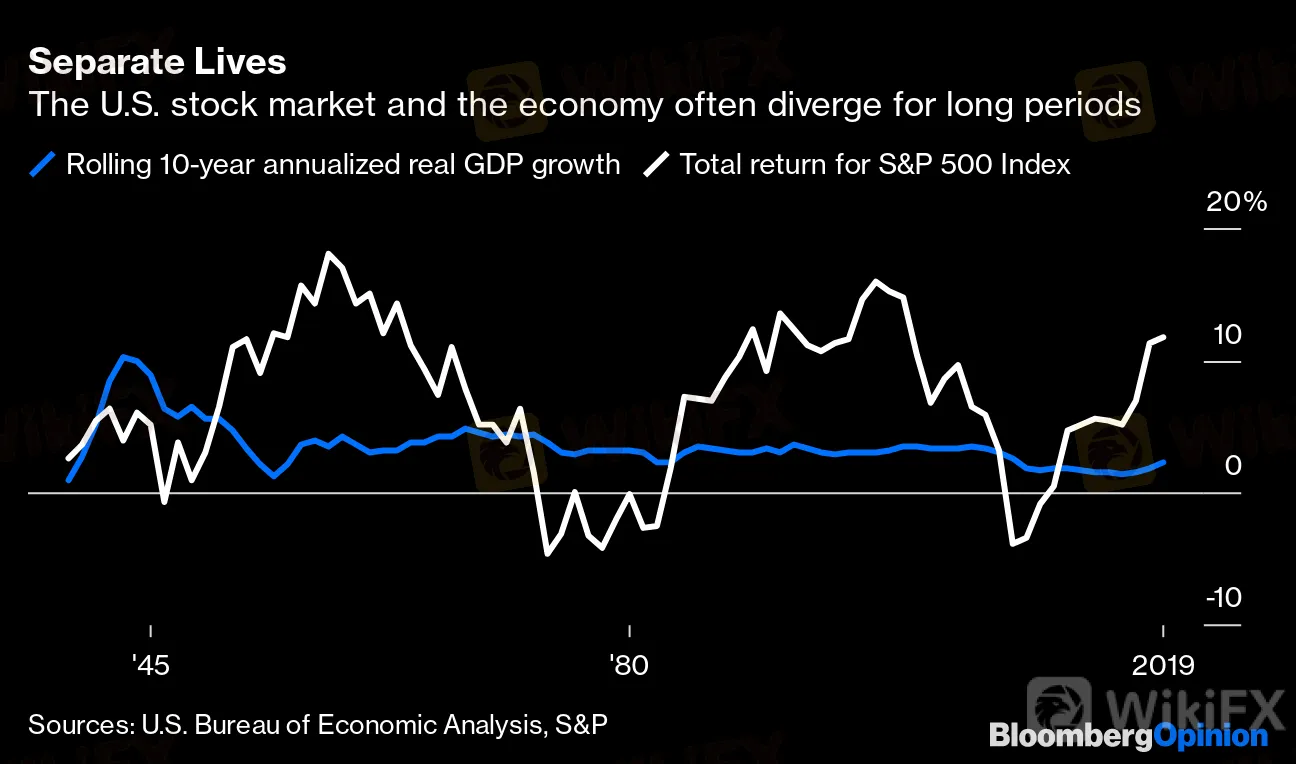
Granted, investors‘ views about individual companies are often informed by the broader environment, but there’s never been a reliable relationship between the market and the economy. For example, the correlation between annual changes in real, or inflation-adjusted, gross domestic product and annual real returns for the S&P 500, including dividends, was 0.09 from 1930 to 2019, the longest period for which overlapping numbers are available. In other words, there was no correlation at all. (A correlation of 1 implies that two variables move perfectly in the same direction, whereas a correlation of negative 1 implies that two variables move perfectly in the opposite direction.)
The relationship between the market and the economy is no more reliable over other periods. Their correlation was a negative 0.04 over rolling 10-year periods — here again, no correlation at all. In fact, if there‘s any reliable relationship between the two, it’s that the market and the economy have a habit of parting ways, and for long periods. The S&P 500, for instance, outpaced GDP growth by 13 percentage points a year after inflation during the 1950s and then lagged it by 5 percentage points during the 1970s. More recently, the S&P 500 trailed GDP growth by 5 percentage points a year during the 2000s, and then beat it by 10 percentage points during the last decade. The periods when the two have moved in tandem are rare exceptions.
Separate Lives
The U.S. stock market and the economy often diverge for long periods
Sources: U.S. Bureau of Economic Analysis, S&P

Nor is there any discernible relationship between the market and the broader political or social environment. Pick your tumultuous decade. The S&P 500 returned 3% a year after inflation during the 1930s, even as the Great Depression transformed the American political landscape. It also returned 3% a year during the 1940s, despite a horrific world war. And it returned 5% a year during the stormy 1960s. Or pick any year — youll find no pattern of the market wilting in the face of turmoil. In 1968, for example, perhaps the most turbulent year in modern American history before the current one, the S&P 500 handed investors a real return of 6%.
Still, the jarring juxtaposition of a booming market amid the current chaos has birthed no shortage of theories about what‘s behind the rally, few of which stand up to scrutiny. One pervasive theory is that the Federal Reserve is propping up the stock market. In an effort to revive the economy and avert a financial crisis, the Fed lowered short-term interest rates to near zero, injected roughly $3 trillion of stimulus into the economy, mostly by purchasing Treasuries and other bonds, and committed to spending as much as necessary to keep bond markets running smoothly. Those moves no doubt had a direct impact on bond prices, but there’s scant evidence that they affected stocks.
This Fed theory isn‘t new. It was circulated widely during the bull run that followed the 2008 financial crisis. Then as now, the Fed lowered rates to near zero and spent roughly $3 trillion. But as I’ve pointed out before, 94% of the S&P 500‘s return from 2010 to 2019 could be attributed to dividends and earnings growth and only 6% to valuation expansion, or the willingness of investors to pay more for stocks. In other words, stocks went up because companies made more money, not because the Fed induced a stock-buying binge. That’s consistent with the experience of Europe and Japan during the same period, when a flood of stimulus by central banks failed to overcome tepid earnings growth and lift stock markets.
Another prominent theory is that a handful of sought-after stocks have hijacked the market and pulled it higher. It‘s true that the NYSE FANG+ Index, which includes investor favorites such as Facebook, Apple, Amazon, Netflix and Google parent Alphabet, notched a record on Monday and is up 49% since March 23. It’s also true that seven of the 10 stocks in the FANG index account for 16% of the S&P 500 by market value. (Of the remaining three, two are Chinese companies and Tesla hasnt yet been invited to the club.) But the median return among all S&P 500 companies was 52% during the same period. In that light, the FANGs have hardly been remarkable.
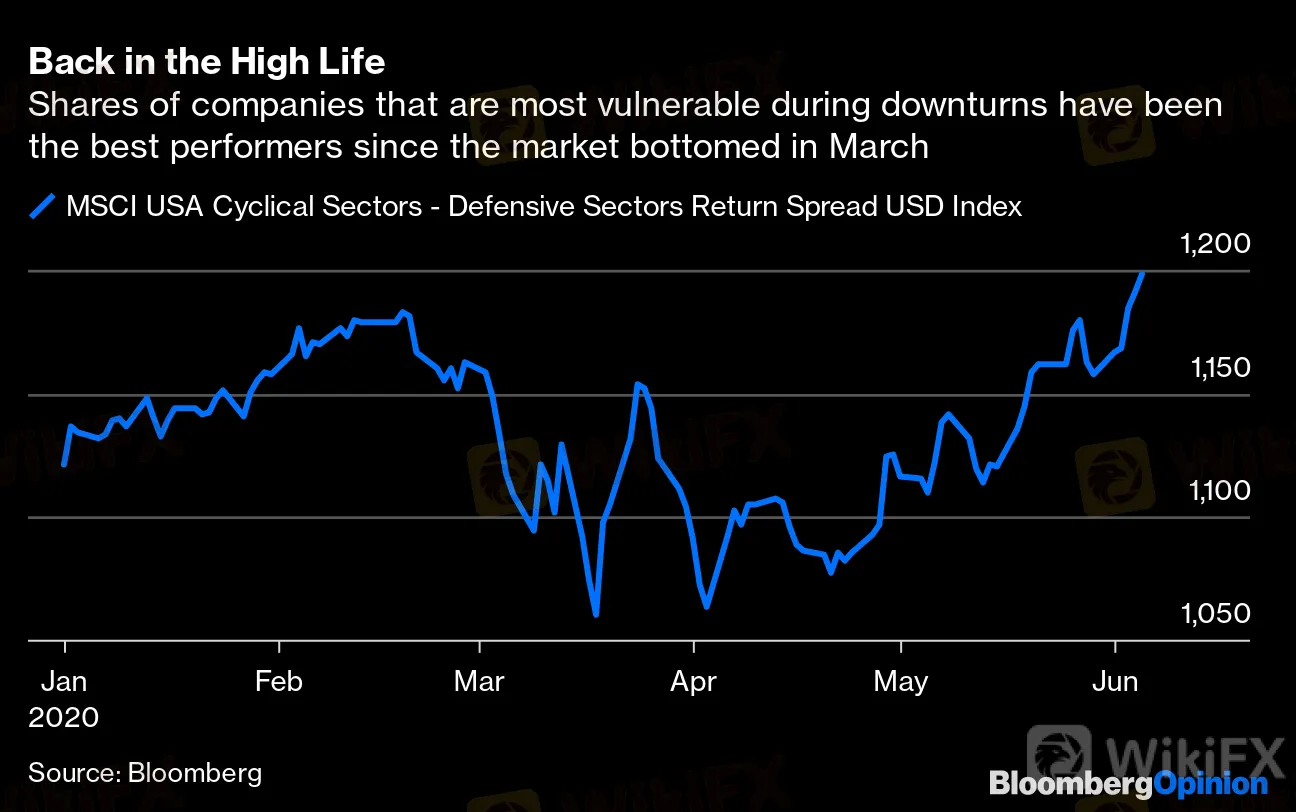
So what is behind the stock market rally? The answer is a bold and unequivocal consensus that a robust earnings recovery is on the way. To see that, one must look deeper than the headline numbers. Consider this: The top 20 best-performing stocks in the S&P 500 since March 23 posted a median return of 151%, more than triple the return of the FANG index. Ten of them, including four of the top five, are energy companies, a sector that was in dire shape just two months ago. The remaining stocks are financial services, cruise lines, casinos and retailers — many of them businesses that were widely expected to have gone bust by now.
Back in the High Life
Shares of companies that are most vulnerable during downturns have been the best performers since the market bottomed in March
Source: Bloomberg

The rest of the S&P 500 tells the same story. Among the top half of best-performing stocks in the index since March 23, 70% are from sectors that were hit hardest by the coronavirus and related shutdown — consumer discretionary, energy, financials, industrials and materials — and 30% are from sectors that better withstood or even benefited from it — consumer staples, health care, technology, real estate, communications and utilities. The bottom half is exactly the opposite.
That doesnt mean the consensus is right to expect a surge in earnings, of course. Some prominent investors have already expressed their skepticism, including David Tepper, Bill Miller and Paul Tudor Jones. As did I. Jeremy Grantham joined the chorus last week, writing in a note that the “market seems lost in one-sided optimism when prudence and patience seem much more appropriate.” Nor would a surge in earnings necessarily translate into a broader surge for the economy, as the last decade and many before it have demonstrated.
Right or wrong, it‘s useful to bear in mind that the stock market’s job is to impart the consensus around companies, not opine on or account for the broader political, social or even economic environment. And a good thing, too. It has rarely been good at it.
Disclaimer:
The views in this article only represent the author's personal views, and do not constitute investment advice on this platform. This platform does not guarantee the accuracy, completeness and timeliness of the information in the article, and will not be liable for any loss caused by the use of or reliance on the information in the article.
WikiFX Broker
Latest News
High-Potential Investments: Top 10 Stocks to Watch in 2025
US Dollar Insights: Key FX Trends You Need to Know
Why Is Nvidia Making Headlines Everywhere Today?
Discover How Your Trading Personality Shapes Success
FINRA Charges UBS $1.1 Million for a Decade of False Trade Confirmations
Bitcoin in 2025: The Opportunities and Challenges Ahead
BI Apprehends Japanese Scam Leader in Manila
Big News! UK 30-Year Bond Yields Soar to 25-Year High!
SQUARED FINANCIAL: Your Friend or Foe?
Join the Event & Level Up Your Forex Journey
Currency Calculator


