简体中文
繁體中文
English
Pусский
日本語
ภาษาไทย
Tiếng Việt
Bahasa Indonesia
Español
हिन्दी
Filippiiniläinen
Français
Deutsch
Português
Türkçe
한국어
العربية
Gold Prices Eyes Topside Target, Silver Prices Slightly Outperforming Gold
Abstract:Gold Prices Eyes Topside Target, Silver Prices Slightly Outperforming Gold
Gold & Silver Price Analysis and Talking Points:
Gold Price Outlook Remains Bullish
Silver Prices Slightly Outperforming Gold
See our quarterly gold forecast to learn what will drive prices throughout Q3!
Gold Price Outlook Remains Bullish
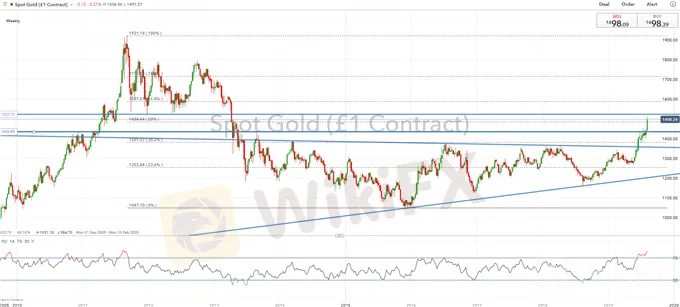
Despite the US Dollar holding up relatively well in recent sessions, gold prices have continued to extend on its gains, hitting fresh 6yr highs at $1500 amid the plunge in global bond yields. As the drop-in bond yields persist, the opportunity cost of holding gold continues to diminish. However, given the size of the move in gold in recent sessions, there is a potential risk of slight exhaustion, thus making the risk reward for a further move higher at current levels slightly less attractive. As such, eyes will be on for a potential pullback for a better opportunity to have a bullish bias. That said, the medium-term outlook continues to remain bullish for the precious metal as the Federal Reserve continue to ease policy, while trade war tensions weigh on economic performance. Topside targets would be for a break of $1522 to open a move towards $1550.
GOLD Technical Levels
Resistance 1: $1522 (Triple Bottom)
Support 1: $1433 (August 2013 High)
Support 2: $1381 (38.2% Fib)
GOLD PRICE CHART: Daily Time-Frame (Sep 2009 -Aug 2019)

What You Need to Know About the Gold Market
Silver Price Outlook | Slightly Outperforming Gold
Silver prices have surged higher following a clean break of the descending trendline stemming from the November 2016 peak. In turn, this has seen silver prices push through the $17 level. Silver has continued to outperform gold prices as the gold/silver ratio heads lower, albeit ever so slightly. On the technical front, topside resistance resides at $17.54, which marks the 50% fib from the 2016 peak to the 2018 low. While a slight negative divergence on the RSI raises the risk of a slight pullback.
Silver Price Chart: Daily Timeframe (Oct 2018 – Jul 2019)

Disclaimer:
The views in this article only represent the author's personal views, and do not constitute investment advice on this platform. This platform does not guarantee the accuracy, completeness and timeliness of the information in the article, and will not be liable for any loss caused by the use of or reliance on the information in the article.
Read more

Weekly Economic Calendar: Key Events Impacting USD, JPY, GBP, EUR, and Gold (XAU)
This week's economic calendar is packed with key events affecting USD, JPY, GBP, EUR, and Gold (XAU). In the USA, watch for Core PCE Price Index, ISM Manufacturing PMI, Initial Jobless Claims, and JOLTs Job Openings. Japan releases the Tankan Large Manufacturers Index and Services PMI. The UK focuses on Manufacturing and Construction PMI, while the Eurozone releases CPI and Services PMI data. Each event's potential impacts on currencies and gold are analyzed for market insights.

GOLD TRADING ANALYSIS
Gold is expected to trade at 1866.03 USD/t oz

Gold Price Forecast: Bullion May Rise Further on Rising Inflation, Breakeven Rates
GOLD, XAU/USD, INFLATION, TREASURY YIELDS, BREAKEVEN RATES– TALKING POINT

Silver Price Outlook: XAG/USD Breakout Testing Uptrend Resistance
Silver prices surged nearly 30% off the May lows with the rally now probing critical resistance. Here are the levels that matter on the XAG/USD weekly chart.
WikiFX Broker
Latest News
Geopolitical Events: What They Are & Their Impact?
Top 10 Trading Indicators Every Forex Trader Should Know
Why Do You Feel Scared During Trade Execution?
Currency Calculator


