简体中文
繁體中文
English
Pусский
日本語
ภาษาไทย
Tiếng Việt
Bahasa Indonesia
Español
हिन्दी
Filippiiniläinen
Français
Deutsch
Português
Türkçe
한국어
العربية
Crude Oil Prices Eye 2-Month Low as Trade War Sours Global Growth
Abstract:Crude oil prices seem poised to revisit two-month lows near the $50/bbl figure as US-China trade war escalation sours global economic growth expectations.
CRUDE OIL & GOLD TALKING POINTS:
Crude oil prices drop to 3-week low, set sights on $50/bbl figure
Gold prices surge as trade war worries drive bond yields lower
Feds Evans may cool rate cut bets, cooling risk appetite further
A recovery on Wall Street after Mondays eyewatering losses did not extend into the commodities space. Cycle-sensitive crude oil prices fell, and bond yields tracked lower amid speculation that the US-China trade war will compound pressure on already weakening global economic growth, spurring on Fed rate cuts. Gold prices were understandably buoyed by such a prospect, setting a new six-year high.
More of the same looks likely ahead. Bellwether S&P 500 futures point lower before the opening bell in New York, warning that yesterdays bounce might have been a brief correction. Comments from Chicago Fed President Charles Evans might help cool risk appetite if he signals the FOMC is no hurry to cut rates again. His St Louis colleague James Bullard suggested as much yesterday (as expected).
EIA inventory flow figures top a barebones data docket. Traders expect to see a 2.5-million-barrel drawdown. API flagged a larger 3.4-million-barrel outflow yesterday, with anything smaller than that now seemingly unlikely to impress investors and offset any broader sentiment-driven selling pressure. An unexpectedly larger drop may help a bit, but upside follow-through seems unlikely given the dour macro backdrop.
Get the latest crude oil and gold forecasts to see what will drive prices in the third quarter!
GOLD TECHNICAL ANALYSIS
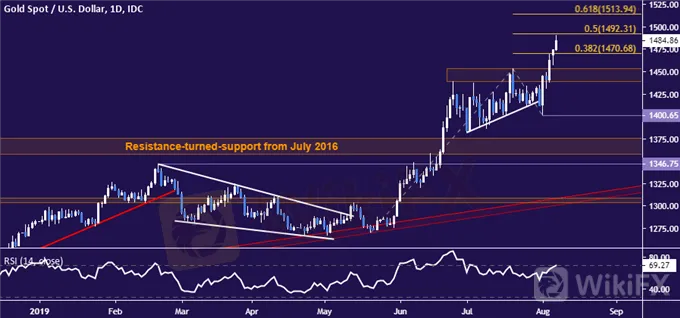
Gold prices continue to push upward, testing resistance marked by the 50% Fibonacci expansion at 1470.68. A daily close above that exposes the 61.8% level at 1513.94. Alternatively, a move back below the 38.2% level at 1470.68 opens the door for a retest of resistance-turned-support in the 1439.14-1452.95 area.

Gold price chart created using TradingView
CRUDE OIL TECHNICAL ANALYSIS
Sellers returned to the offensive after a brief consolidative pause, pushing crude oil prices to a three-week low. Immediate support is in the 49.41-50.60 area, with a daily close below that setting the stage to test the 42.05-43.00 zone. Alternatively, a move above 56.09 targetsback-to-back falling trend line and inflection zone resistance running up through 60.84.

Disclaimer:
The views in this article only represent the author's personal views, and do not constitute investment advice on this platform. This platform does not guarantee the accuracy, completeness and timeliness of the information in the article, and will not be liable for any loss caused by the use of or reliance on the information in the article.
Read more

Weekly Analysis: XAU/USD Gold Insights
Gold prices have been highly volatile, trading near record highs due to various economic and geopolitical factors. Last week's weak US employment data, with only 114,000 jobs added and an unexpected rise in the unemployment rate to 4.3%, has increased the likelihood of the Federal Reserve implementing rate cuts, boosting gold's appeal. Tensions in the Middle East further support gold as a safe-haven asset. Technical analysis suggests that gold prices might break above $2,477, potentially reachin

KVB Today's Analysis: USD/JPY Eyes Volatility Ahead of BoJ Policy Meeting and US Data
The USD/JPY pair rises to 154.35 during the Asian session as the Yen strengthens against the Dollar for the fourth consecutive session, nearing a 12-week high. This is due to traders unwinding carry trades ahead of the Bank of Japan's expected rate hike and bond purchase tapering. Recent strong US PMI data supports the Federal Reserve's restrictive policy. Investors await US GDP and PCE inflation data, indicating potential volatility ahead of key central bank events.

Today's analysis: USDJPY Poised for Increase Amid Bank of Japan's Strategy
The USD/JPY is expected to rise. The Bank of Japan will keep interest rates between 0 and 0.1% and continue its bond purchase plan but may reduce purchases and raise rates in July based on economic data. Technically, the pair is trending upward with resistance at $158.25 and $158.44, and support at $157.00, $156.16, and $155.93.

USDJPY Predicted to Rise on Yen Depreciation
The USD/JPY pair is predicted to increase based on both fundamental and technical analyses. Fundamental factors include a potential easing of aggressive bond buying by the Bank of Japan (BoJ), which could lead to yen depreciation. Technical indicators suggest a continuing uptrend, with the possibility of a correction once the price reaches the 157.7 to 160 range.
WikiFX Broker
Latest News
Two Californians Indicted for $22 Million Crypto and NFT Fraud
RM62k Lost Investment Scam After Joining XRP Community Malaysia on Telegram
Victims of Financial Fraud in France Suffer Annual Losses of at Least €500 Million
WikiFX Review: Is Ultima Markets Legit?
Colorado Duo Accused of $8M Investment Fraud Scheme
What Impact Does Japan’s Positive Output Gap Have on the Yen?
Macro Markets: Is It Worth Your Investment?
Trading is an Endless Journey
SEC Warns on Advance Fee Loan Scams in the Philippines
Malaysia Pioneers Zakat Payments with Cryptocurrencies
Currency Calculator


