简体中文
繁體中文
English
Pусский
日本語
ภาษาไทย
Tiếng Việt
Bahasa Indonesia
Español
हिन्दी
Filippiiniläinen
Français
Deutsch
Português
Türkçe
한국어
العربية
Crude Oil Price Outlook: Sellers React at Confluent Resistance
Abstract:WTI crude oil prices put in a strong show of volatility in the second-half of Q2, and Q3 has so far been quieter following last weeks resistance reaction.
Crude Oil Price Outlook Talking Points:
原油价格展望谈话要点:
Crude oil prices have been relatively quiet so far in Q3, and this follows a rush of volatility that showed in the second-half of Q2.
到目前为止原油价格相对平静在第三季度,这是在第二季度下半年出现的波动加剧之后发生的。
Crude oil prices are currently seeing resistance at a confluent zone on the chart while remaining below an aggressively-sloped bearish trendline.
原油价格目前在汇合时出现阻力图表上的区域保持在积极倾斜的看跌趋势线下方。
Crude Oil Prices Sticking to Resistance as Q3 Starts with Stability
原油价格坚持抵抗第三季度开始稳定
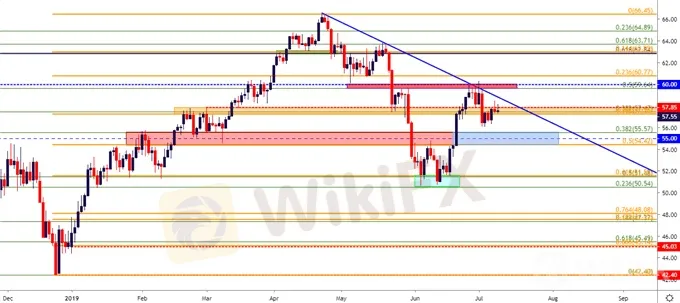
Crude Oil prices continue to exhibit a tone of stability following a rush of volatility that showed in the second-half of Q2. After a strong sell-off spanned from late-April into early-June, a bullish ramp developed a few weeks ago that propelled prices into a confluent zone of resistance. This came-in around the 60-handle on WTI crude oil, with an assist from a bearish trendline taken from the April and May swing highs. Bulls did not give up easily there, as a week of struggle was accented by a flare in geopolitical tensions; but this was eventually won-out by bears posing a bearish shift last week, keeping oil bulls on the back foot as the potential for a larger breakdown remains.
原油价格在第二季度下半年出现波动之后继续表现出稳定的基调。在经历了从4月底到6月初的强劲抛售之后,几周前出现了一个看涨斜坡,推动价格进入汇合区域。这是围绕WTI原油的60手柄进行的,受益于4月和5月摆动高点的看跌趋势线。公牛队并没有轻易放弃,因为地缘政治紧张局势加剧了一周的斗争;但最终由于上周出现看跌转移的空头而被淘汰出局,因为更大的崩溃可能性仍然存在,因此保持油价多头。
WTI Crude Oil Daily Price Chart
WTI原油每日报价图表

Chart prepared by James Stanley
图表由James Stanley编写
{12} 图表由James Stanley编写 {12}
In last week‘s technical piece on crude oil, a deeper zone of potential support/resistance was looked at that spanned from 57.26-57.85, with the latter of those prices functioning as the February swing-high along with both 57.25 and 57.47 as confluent Fibonacci levels. Price action posed an initial break below this zone after last week’s bearish push, but prices have since retraced back into this zone with sellers showing a response as indicated by the upper wicks on the four-hour chart from the past few trading days. This can keep the door open for short-side swing approaches, targeting a re-test of the 55-area on the chart.
最后本周关于原油的技术报告,从57.26-57.85看,潜在支撑/阻力的更深区域,其中后者的价格运行2月份的涨幅以及57.25和57.47均为融合斐波那契水平。在上周的看跌推动之后,价格行动在该区域下方初步突破,但价格已回撤至该区域,卖方显示出过去几个交易日四小时图上的上部灯芯显示的反应。这可以为短边摆动方向敞开大门,目标是重新测试图表上55个区域。
WTI Crude Oil Four-Hour Price Chart
WTI原油四小时价格走势图 p>

Chart prepared by James Stanley
WTI Crude Oil Longer-Term
WTI原油期限较长期
Should that area around the price of 55 soon give way, theres an additional area of support below that could remain of interest, and this takes place from 50.54-51.59. This was looked at coming into June and this is the area that bulls re-grabbed control of crude oil price action last month. This could remain as a secondary area of support potential should the decline continue, after which the psychological level of 50 comes into play.
如果55左右的价格区域很快就会让位,那么下方的额外支撑区域可能仍会引起人们的兴趣,这个区域发生在50.54-51.59之间。这看起来是在六月份,这是多头上个月重新控制原油价格行动的区域。如果继续下降,这可能仍然是支持潜力的次要领域,之后50的心理水平发挥作用。
On the bullish side of oil prices, given the amount of resistance that showed around the 60-handle, traders would likely want to wait for a confirmed break of that zone before looking to re-institute bullish strategies on WTI crude oil.
在油价的看涨方面,给定金额在60手柄附近显示阻力位,交易者可能希望等待该区域的确认突破,然后再寻求重新制定对WTI原油的看涨策略。
WTI Crude Oil Weekly Price Chart
WTI原油周价格图表

Chart prepared by James Stanley
图表由James Stanley编写
Disclaimer:
The views in this article only represent the author's personal views, and do not constitute investment advice on this platform. This platform does not guarantee the accuracy, completeness and timeliness of the information in the article, and will not be liable for any loss caused by the use of or reliance on the information in the article.
WikiFX Broker
Latest News
Elderly Trader Loses RM2.1M in WhatsApp Forex Scam
Spotware Unveils cTrader Store, Global Marketplace for Algo Creators
Gigamax Scam: Tracking Key Suspects in RM7 Million Crypto Fraud
WikiFX Review: Is IQ Option trustworthy?
CFI Partners with MI Cape Town, Cricket Team
Doo Financial Expands Reach with Indonesian Regulatory Licenses
Quadcode Markets: Trustworthy or Risky?
5 Questions to Ask Yourself Before Taking a Trade
Avoid Fake Websites of CPT Markets
Webull Canada Expands Options Trading to TFSAs and RRSPs
Currency Calculator


