简体中文
繁體中文
English
Pусский
日本語
ภาษาไทย
Tiếng Việt
Bahasa Indonesia
Español
हिन्दी
Filippiiniläinen
Français
Deutsch
Português
Türkçe
한국어
العربية
US Dollar Price Outlook: USD Back to 97.70, Bulls Push Ahead of FOMC
Abstract:US Dollar bulls have come back to bid the currency higher after a test of a big zone of support. But can they keep control through tomorrow's FOMC?
US Dollar Price Outlook Talking Points
美元价格展望谈话要点
After a bearish start to the month of June, the US Dollar has rallied back to a key level of prior resistance around the 97.70 level on DXY.
在6月份看跌开始后,美元已回升至DXY 97.70附近先前阻力的关键水平。
While dovish FOMC policy was getting priced-in earlier this month, the wide expectation now appears to be set up for an FOMC disappointment in which the bank comes out more hawkish than what rates markets are looking for. This can keep alive themes such as AUDUSD weakness, or USDCAD strength. Also of interest could be the short-side of USDJPY, as looked at in this weeks FX Setups.
虽然温和的FOMC政策早些时候定价本月,人们普遍认为FOMC令人失望,因为该银行的出现比市场所期望的更为强硬。这可以保持活跃的主题,如澳元兑美元疲软或美元兑加元强势。同样令人感兴趣的可能是美元兑日元的空头,正如本周FX设置所看到的那样。
USD Bulls Show Up for FOMC
美元公牛队出现在FOMC上
Was the early-June sell-off in the US Dollar a mirage? Or were markets perhaps getting in-front of themselves by starting to price-in rate cuts out of the Federal Reserve?
美元6月初的抛售是海市蜃楼吗?或者是市场可能通过开始降价来进入市场削减美联储?
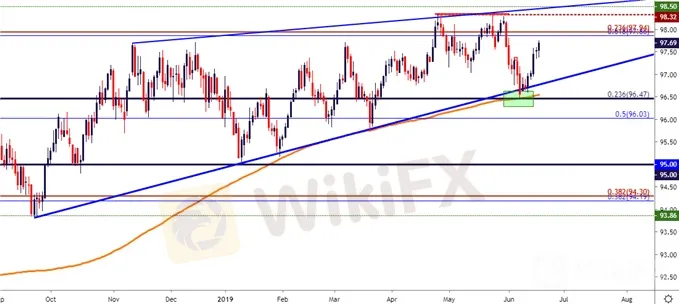
The US Dollar had been trending higher since last September, starting from around a low of 93.86 and continuing to push higher after the 2019 open. But throughout that ramp, a level of resistance had shown up that proved difficult to break, and this ran around the level of 97.70 in DXY. This same price topped-out the move in October and November; and then again in early-March. This even came into play again in late-April, but the fourth time was the charm as buyers were finally able to breakaway to a fresh yearly high in the currency. That run lasted all the way to 98.33 but, similar to 97.70, buyers all-of-the-sudden got bashful once this price came into play and the bullish advance pulled back. A second failed attempt to break-through that level in late-May opened the door to a bearish response in early-June; and bears pounced on the opportunity to push prices down to a very key area of support on the charts.
美元自去年9月以来一直走高,从大约93.86的低点开始,并在2019年开盘后继续走高。但是在整个斜坡上,出现了一个难以突破的阻力水平,这在DXY中达到了97.70的水平。同样的价格在10月和11月达到了最高点;然后在3月初再次。这甚至在4月下旬再次发挥作用,但第四次是魅力,因为买家终于能够突破到货币新的年度高点。那次跑步持续到98.33,但是,与97.70类似,一旦这个价格发挥作用并且看涨推进回落,买家突然变得害羞。 5月底第二次破坏这一水平的失败尝试打开了6月初看跌回应的大门;并且有机会将价格推向图表上非常关键的支撑区域。
This is a big area on the chart for the US Dollar: This support is around 96.50, and in this area is the 23.6% Fibonacci retracement of the 2011-2017 major move, as well as the 200-day moving average; along with the bullish trend-line that connects the lows since last September.
这是美元图表上的一个重要区域:这种支撑是在该区域内,该区域是2011 - 2017年重大走势的23.6%斐波纳契回撤位,以及200日均线;和公牛一起自去年9月以来连接低点的趋势线。
US Dollar Daily Price Chart
美元每日价格走势图

Chart prepared by James Stanley
James Stanley编制的图表
FOMC: Anticipate the Anticipation
FOMC:预期预期
Making matters more interesting is what‘s been doing the driving. Coming into the month of June, US equities were on their backfoot as there was a pervasive fear that the Fed would be more-hawkish than what markets were looking for. Some supportive comments from Jerome Powell two weeks ago helped to bring buyers back into stocks, and already, the S&P 500 has leapt back towards prior highs. But, also going along with that theme was a bearish push in the US Dollar as investors priced-in rate cuts out of the Fed for the remainder of this year. Even today there’s a 58.2% probability of at least three rate cuts by the end of 2019.
让事情变得更有趣的是正在开车的事情。进入6月份,由于人们普遍担心美联储会比市场所寻求的更加强硬,美国股市仍处于后脚。两周前杰罗姆鲍威尔的一些支持性评论帮助买家重新回到股票市场,标准普尔500指数已经回升至之前的高位。但是,随着投资者在今年剩余时间内将美联储的利率降息排除在外,同样伴随着这一主题的是对美元的看跌推动。即使在今天,到2019年底至少有三次降息的可能性为58.2%。
But, the Fed may be in a difficult spot justifying three full rate cuts, especially after a year in which we just had three hikes. Inflation remains near target and if the Fed is, in fact, going to serve their dual mandate, a full 75 basis points of loosening would be difficult to justify. So over the past week-and-change, as US data has come in ‘not all that bad,’ buyers have come back, pushing the Dollar right back towards that 97.70 level that had thrice turned around bullish advances from October-April.
但是,美联储可能处于一个困难的位置,证明三次全面降息,尤其是我们刚刚三次徒步旅行的一年。通货膨胀仍然接近目标,如果事实上美联储将履行其双重任务,那么完全放松75个基点是不合理的。因此,在过去一周又一周的变化中,由于美国数据“并非一切都那么糟糕”,买家已经回来,推动美元回到97.70水平,这一水平在10月至4月期间扭转了三次上涨。 / p>
US Dollar Eight-Hour Price Chart
美元八小时价格图表

FOMC: Focus on the Dots
FOMC:专注于点
Given that there‘s little expectation for a move at tomorrow’s rate decision, the predominant focus will likely be paid to the banks Summary of Economic Projections. The dot plot matrix will host expectations for future rate moves and investors will be scanning this to see just how dovish the Fed anticipates being in the remainder of this year.
鉴于对明天的利率决定采取行动的预期很少,因此可能会向银行的经济预测摘要支付主要关注点。点p矩阵将主持对未来利率走势的预期,投资者将扫描这一预测,看看美联储预计今年剩余时间将会有多么温和。
The big question is whether the bank will meet or even come close to the market‘s demands for dovish policy. Doing so could bring USD bears back into the mix, helping to elicit another test of support. This could make the topside of EURUSD or perhaps even Gold as attractive. EURUSD has pulled back from last week’s fresh two-month-highs and is currently testing a big zone of support that runs from 1.1187-1.1212.
最大的问题是银行将满足甚至接近市场对鸽派政策的要求。这样做可能会使美元空头回到混合状态,从而有助于引发另一次支持测试。这可能使得欧元兑美元的上行甚至黄金都具有吸引力。欧元兑美元从上周新的两个月高点回落,目前正在测试1.1187-1.1212的大支撑位。
EURUSD Daily Price Chart
欧元兑美元每日价格走势图

Chart prepared by James Stanley
图表由James Stanley编写
Disclaimer:
The views in this article only represent the author's personal views, and do not constitute investment advice on this platform. This platform does not guarantee the accuracy, completeness and timeliness of the information in the article, and will not be liable for any loss caused by the use of or reliance on the information in the article.
WikiFX Broker
Latest News
AIMS Broker Review
The Hidden Checklist: Five Unconventional Steps to Vet Your Broker
Russia to Fully Ban Crypto Mining in 10 Regions Starting January 1, 2025
YAMARKETS' Jingle Bells Christmas Offer!
Why is there so much exposure against PrimeX Capital?
Two Californians Indicted for $22 Million Crypto and NFT Fraud
WikiFX Review: Is Ultima Markets Legit?
Colorado Duo Accused of $8M Investment Fraud Scheme
MTrading’s 2025 "Welcome Bonus" is Here
FCA's Warning to Brokers: Don't Ignore!
Currency Calculator


