简体中文
繁體中文
English
Pусский
日本語
ภาษาไทย
Tiếng Việt
Bahasa Indonesia
Español
हिन्दी
Filippiiniläinen
Français
Deutsch
Português
Türkçe
한국어
العربية
Gold Price Outlook: Rally From Fib Support, Gold Nears ‘Danger Zone’
Abstract:Bulls have come back into Gold with aggression, pushing prices towards five-year-highs. But, can that enthusiasm last as longer-term resistance comes into play?
Gold Price Outlook Talking Points:
Gold prices continue to exhibit volatility after the early-June ramp to fresh three-month-highs.
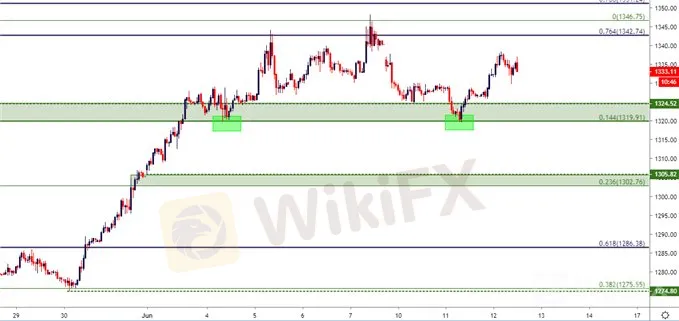
Gold prices softened from resistance as looked at last Thursday, and support has come-in right at the Fibonacci level of 1319.91 that was investigated for higher-low support potential.
Gold prices have almost completed the fill of this weeks opening gap; but the bigger question is for how long might buyers be able to push with a big zone of resistance sitting overhead.
DailyFX Forecasts are published on a variety of currencies such as Gold, the US Dollar or the Euro and are available from the DailyFX Trading Guides page. If youre looking to improve your trading approach, check out Traits of Successful Traders. And if youre looking for an introductory primer to the Forex market, check out our New to FX Guide.
Gold Prices Bounce from Fib Support, Re-Approach Long-Term Resistance
Gold prices are holding near three-month-highs after the bullish ramp began two weeks ago. As discussed last Thursday, the topside ramp in Gold was already getting stretched, but the force shown by buyers up to that point gave little reason to question viability of bullish continuation scenarios. The support level looked at to open the door for bullish scenarios soon came into play, and this is taken from the zone that runs from the 1319.91 Fibonacci level up to the 1324.56 swing-high from March price action.
Gold Price Hourly Chart

Are Gold Prices Nearing a Fresh Five-Year-High?
As discussed last Thursday as well as earlier in May with a longer-term look, a big zone of resistance sits atop Gold prices. This area runs from 1357.50 up to 1366.10; and just beyond that is the 2016 high at 1375.15. And while this area has previously proven difficult to break-through for bulls, this scenario should at least be entertained given the current backdrop behind Gold prices. I had looked at ‘bigger picture’ breakout potential as Gold prices were in the midst of consolidation in May; and our own Rich Dvorak pointed out the shifting backdrop behind Gold volatility a day before this current breakout began. At 3PM on May 29th, Rich published the article entitled, Gold & US Dollar Threaten Breakout as Rate Volatility Spikes. Twelve hours later Gold prices had run into support; and a week after that, Gold prices had moved up by almost a full $70.
Gold Price Weekly Chart: Wedge Breakout Propelled into Resistance

Gold Price Strategy Moving Forward
The primary challenge around bullish approaches at the moment is proximity to recent support. With Gold prices having rallied so far from yesterdays lows, traders may have a difficult time justifying the risk required for bullish trend strategies.
This can keep the door open for topside breakout strategies, looking for breaches of resistance to lead into a test of the next resistance level on the chart. Below, I look into a number of potential resistance levels currently sitting atop price action that could be utilized for such an approach. Prior points of interest exist at 1346.75, 1351.24, 1357.50, 1361.72 and 1366.06.
Gold Price Daily Chart

Outside of that, traders may be able to use shorter-term dynamics to work-in to the long side of Gold prices; looking at near-term support around the 1330 handle. A hold of support here could keep the door open for short-term trend strategies, targeting a return to the 1342 and 1346 Fibonacci levels. If those targets come into play in short-order, break-even stops could be incorporated to look for further breakout potential.
Gold Price Hourly Chart

Chart prepared by James Stanley
To read more:
Are you looking for longer-term analysis on the U.S. Dollar? Our DailyFX Forecasts have a section for each major currency, and we also offer a plethora of resources on Gold or USD-pairs such as EUR/USD, GBP/USD, USD/JPY, AUD/USD. Traders can also stay up with near-term positioning via our IG Client Sentiment Indicator.
Forex Trading Resources
DailyFX offers an abundance of tools, indicators and resources to help traders. For those looking for trading ideas, our IG Client Sentiment shows the positioning of retail traders with actual live trades and positions. Our trading guides bring our DailyFX Quarterly Forecasts and our Top Trading Opportunities; and our real-time news feed has intra-day interactions from the DailyFX team. And if you‘re looking for real-time analysis, our DailyFX Webinars offer numerous sessions each week in which you can see how and why we’re looking at what were looking at.
Disclaimer:
The views in this article only represent the author's personal views, and do not constitute investment advice on this platform. This platform does not guarantee the accuracy, completeness and timeliness of the information in the article, and will not be liable for any loss caused by the use of or reliance on the information in the article.
WikiFX Broker
Latest News
AIMS Broker Review
The Hidden Checklist: Five Unconventional Steps to Vet Your Broker
YAMARKETS' Jingle Bells Christmas Offer!
Why is there so much exposure against PrimeX Capital?
Russia to Fully Ban Crypto Mining in 10 Regions Starting January 1, 2025
Two Californians Indicted for $22 Million Crypto and NFT Fraud
WikiFX Review: Is Ultima Markets Legit?
Colorado Duo Accused of $8M Investment Fraud Scheme
MTrading’s 2025 "Welcome Bonus" is Here
FCA's Warning to Brokers: Don't Ignore!
Currency Calculator


