简体中文
繁體中文
English
Pусский
日本語
ภาษาไทย
Tiếng Việt
Bahasa Indonesia
Español
हिन्दी
Filippiiniläinen
Français
Deutsch
Português
Türkçe
한국어
العربية
Top 5 Events: May US Jobs Report (NFP) & USDJPY Price Forecast
Abstract:The May US Change in Nonfarm Payrolls report is due on Friday at 12:30 GMT.
US Jobs Report (NFP) Talking Points:
The May US Change in Nonfarm Payrolls report is due on Friday at 12:30 GMT.
Consensus forecasts are calling for headline jobs growth to come in at 180K while the unemployment rate will remain on hold at 3.6%.
Retail traders are buying the US Dollar despite significant losses over the past few days.
Join me on Mondays at 7:30 EDT/11:30 GMT for the FX Week Ahead webinar, where we discuss top event risk over the coming days and strategies for trading FX markets around the events listed below.
06/07 FRIDAY | 12:30 GMT | USD Change in Nonfarm Payrolls & Unemployment Rate (MAY)
The US labor market has been the pillar of stability for the US economy for several years now, and even as Q219 US GDP expectations look soft, the US jobs market looks poised to press forward. With the change in nonfarm payrolls report due to show headline jobs growth of 180K, and the unemployment rate set to edge lower by one-tenth of a percentage point to 3.5%,expectations are as vanilla as they come.
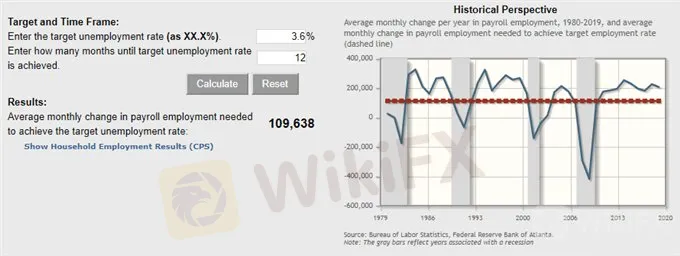
After all, the Atlanta Fed jobs calculator dictates that the US economy only needs 110K jobs per month to maintain the unemployment rate at 3.6% over the next 12-months. From this perspective, even if the actual headline US jobs data were to miss expectations, it would need to miss expectations by nearly 4 standard deviations (1 std dev = 20.74K, per Bloomberg News survey) to produce upwards pressure on the unemployment rate.

Yet from another point of view, given the backdrop of rates markets aggressively pulling forward Federal Reserve rate cut expectations, the upcoming May US jobs report poses asymmetric risk for the US Dollar: a bad report could hit the greenback in a significantly negative manner; a good report may only temporarily stem selling pressure.
Pairs to Watch: DXY Index, EURUSD, USDJPY, Gold
USDJPY Technical Analysis: Daily Price Chart (December 2017 to June 2019) (Chart 1)

USDJPY has been under significant pressure in recent days, with prices falling below key levels of support on the way down. After Fridays weak performance – the worst single-day outcome since the Yen flash crash in January – USDJPY broke through the early-May swing low at 109.02 as well as the January 31 swing low at 108.50. Additionally, USDJPY price has fallen through the 61.8% retracement of the 2018 high/low range at 108.42.
A lot of technical damage was done to the USDJPY chart in a short period of time, and that damage appears to be sticking with prices holding below the 61.8% retracement at 108.42 at the start of the week. Accordingly, Ahead of the May US jobs report release this coming Friday, USDJPY price has a bearish outlook. With the daily 8-, 13, and 21-EMA envelope in sequential order pointing lower, while both daily MACD and Slow Stochastics trend lower in bearish territory, the near-term bias is to sell rebounds in USDJPY.
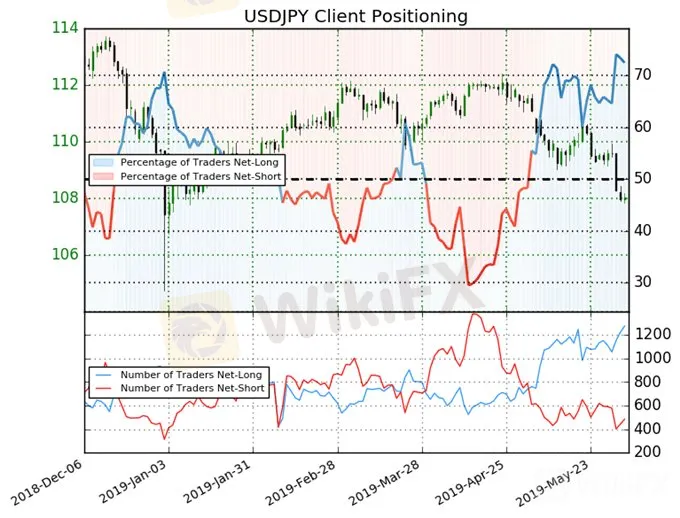
IG Client Sentiment Index: USDJPY (June 4, 2019) (Chart 2)

USDJPY: Retail trader data shows 72.4% of traders are net-long with the ratio of traders long to short at 2.63 to 1. In fact, traders have remained net-long since May 03 when USDJPY traded near 111.449; price has moved 3.1% lower since then. The number of traders net-long is 3.6% higher than yesterday and 11.2% higher from last week, while the number of traders net-short is 9.7% higher than yesterday and 21.8% lower from last week.
We typically take a contrarian view to crowd sentiment, and the fact traders are net-long suggests USDJPY prices may continue to fall. Positioning is less net-long than yesterday but more net-long from last week. The combination of current sentiment and recent changes gives us a further mixed USDJPY trading bias.
Disclaimer:
The views in this article only represent the author's personal views, and do not constitute investment advice on this platform. This platform does not guarantee the accuracy, completeness and timeliness of the information in the article, and will not be liable for any loss caused by the use of or reliance on the information in the article.
Read more

Japanese Yen Caught Out on Fed Hawkishness and Omicron. Will USD/JPY Break?
The Japanese Yen weakened on Fed Chair Powell confirmed hawkishness. APAC equities were mixed, and crude oil remains mired before OPEC+. Omicron universal uncertainty continues. Will USD/JPY gain traction?

US Dollar Leaps on Fed Re-Nomination Pumping Up Treasury Yields. Will USD Keep Going?
The US Dollar rode higher as US yields rose across the curve. Crude oil prices recovered after OPEC+ threw a curve ball. With Thanksgiving almost here, where will USD go on holiday?

Euro (EUR) Price Outlook: No End Yet in Sight for EUR/USD Weakness
EUR/USD continues to tumble, with no sign yet of a rally or even a near-term bounce.. The pair has dropped already beneath the support line of a downward-sloping channel in place since late May this year to its lowest level since July 2020 and there is now little support between here and 1.1170. From a fundamental perspective, the Euro is suffering from a continued insistence by the European Central Bank that much higher Eurozone interest rates are not needed.

Dollar Index (DXY) Soars on Data and Hawkish Fed Lifting Yields. Can USD Fly Higher?
The US Dollar continues to break new ground as momentum gathers. Encouraging economic data and hawkish comments boost yields and USD. Commodities and currencies weaken against the Dollar. Will USD keep going?
WikiFX Broker
Latest News
Volkswagen agrees deal to avoid Germany plant closures
Geopolitical Events: What They Are & Their Impact?
Top 10 Trading Indicators Every Forex Trader Should Know
TradingView Launches Liquidity Analysis Tool DEX Screener
MultiBank Group Wins Big at Traders Fair Hong Kong 2024
WikiEXPO Global Expert Interview: Simone Martin—— Exploring Financial Regulation Change
'Young investors make investment decisions impulsively to keep up with current trends' FCA Reveals
Why Do You Feel Scared During Trade Execution?
CySEC Settles Compliance Case with Fxview Operator Charlgate Ltd
Malaysian Influencer Detained in Taiwan Over Alleged Role in Fraud Scheme
Currency Calculator


