简体中文
繁體中文
English
Pусский
日本語
ภาษาไทย
Tiếng Việt
Bahasa Indonesia
Español
हिन्दी
Filippiiniläinen
Français
Deutsch
Português
Türkçe
한국어
العربية
Dow Jones Outlook: Recovery Continues, Levels to Know
Abstract:US equities continue to recover after a bearish sell-off showed after the May open. But can buyers continue to drive to further recovery prior losses?
Dow Jones Outlook Talking Points:
道琼斯展望谈话要点:
- US equities continue to claw back losses from early-May price action, and prices in the Dow Jones Industrial Average are working on a week of higher-lows following last weeks gap-lower.
- 美国股市继续收回5月初价格走势的损失,道琼斯工业平均指数的价格正在发挥作用在过去几周的低点之后的一周高位低位。
- As the potential for risk aversion remains, with a bit of opacity around the Feds stance combined with worries on the trade-front, buyers have returned to make a push back towards the 26k psychological level.
- 由于风险厌恶的可能性仍然存在,围绕美联储立场的一些不透明以及对此的担忧加上交易方面,买家已经回归到26k心理水平。
- DailyFX Forecasts are published on a variety of currencies such as the US Dollar or the Euroand are available from the DailyFX Trading Guides page. If you‘re looking to improve your trading approach, check out Traits of Successful Traders. And if you’re looking for an introductory primer to the Forex market, check out our New to FX Guide.
- DailyFX预测以各种货币发布,如美元或欧元等。可从DailyFX交易指南页面获取。如果您希望改善您的交易方法,请查看成功交易者的特征。如果您正在寻找外汇市场的入门介绍,请查看我们的新外汇指南。
Do you want to see how retail traders are currently trading GBPUSD? Check out our IG Client Sentiment Indicator.
您想要吗?查看零售交易商目前如何交易GBPUSD?查看我们的IG客户情绪指标。
Dow Jones Continues to Recover From Last Weeks Spill
道琼斯继续从上周的溢油中恢复
{7}
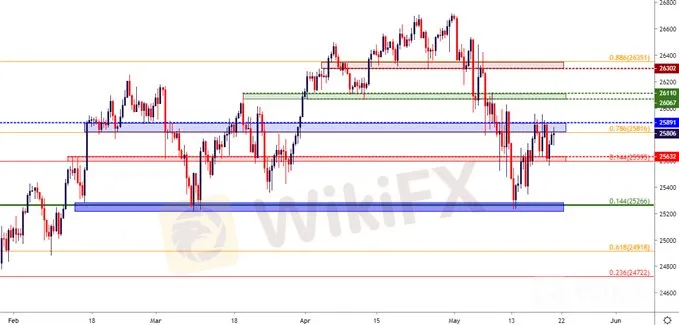
US equities continue to recover following last weeks gap-lower. In Dow futures, last Sundays open saw prices gap-down, and bearish run continued to show amounting to a very ugly Monday for equity bulls. At that point, an element of support came into play around 25,266, which is the same level that helped to set the March low in the Dow. This is derived from the 14.4% Fibonacci retracement of the August 2015 – October 2018 major move and this has helped to mark the three-month-low in the index.
{7}
Dow Jones Eight-Hour Price Chart
道琼斯八-Hour Price Chart

Chart prepared by James Stanley
James Stanley编制的图表
Dow Resistance Test at Last Weeks Highs
最后的道琼斯阻力测试周高点
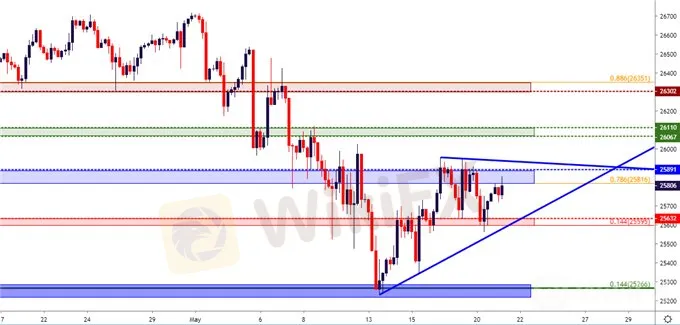
Buyers have continued to shy away from the 26k psychological level as last week‘s advance topped-out around 25,950 on Thursday; and another attempt to take this level out on Friday had failed, leaving a lower-high on the chart ahead of last week’s close. But, similar to last week, sellers took a swing at Dow futures after the weekly open and pushed prices-lower for a re-test of the 25,595 support zone. Different from last week, however, that bearish run was stopped short and buyers soon re-appeared, helping to bring prices back towards last weeks resistance. This gives the appearance of continued topside potential as there are now a series of higher-lows showing on the chart from last weeks gap-lower.
买家继续回避26k的心理水平,因为上周周四的涨幅在25,950附近突破;并试图采取这种做法周五的平局失败,在上周收盘之前在图表上留下了一个较低的高位。但是,与上周相似,卖家在道琼斯指数期货开盘后,在每周开盘后推动价格下跌,重新测试25,595支撑区域。然而,与上周不同的是,看跌行情已经停止,买家很快重新出现,这有助于使价格回到上周的阻力位。这给出了持续上行潜力的外观,因为现在有一系列较高的低点显示在图表上从上周的差距较低。
Dow Jones Four-Hour Price Chart
道琼斯四小时价格走势图

Chart prepared by James Stanley
图表由詹姆斯·斯坦利准备
{14}
Dow Jones Levels to Know
{14}
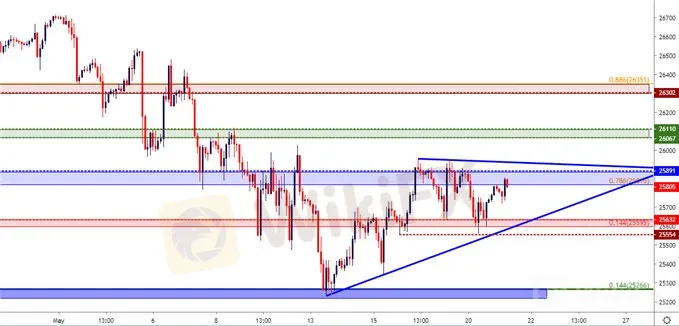
Given the series of higher-lows that have shown through a couple of different bearish waves thus far, and there may be scope for continued topside. The primary complication, at this point, would be the congestion thats developed inside of the 26k psychological level. Above that, a prior area of support resistance could be looked to for follow-through resistance, and this runs from 26,067-26,110. The latter of those prices was the late-March swing-high while the former was the April swing-low. Above that, the next area of interest in the zone that runs from 26,302 up to 26,351. This was a zone of support that held the lows in the index through multiple bearish drives in the last three weeks of April, only being taken-out as bears started to swing with more force after the May open.
鉴于迄今为止已经通过几个不同的看跌波浪显示的一系列高点,并且可能有继续上行的空间。在这一点上,主要的并发症是在26k心理水平内发生的拥挤。在此之上,可以预先看到支撑阻力的先前区域的后续阻力,其从26,067-26,110开始。这些价格的后者是3月下旬的涨幅,而前者是4月份的涨停。在此之上,该区域的下一个感兴趣区域从26,302到26,351。这是一个支撑区域,在4月的最后三周通过多次看跌驱动在指数中保持低点,只是随着5月开盘后空头开始以更大的力量摆动而被取消。
On the bearish side of the Dow, sellers would likely want to see the chain of recent higher-lows to be broken before looking at further downside. That most recent higher-low shows around the 25,544 level, and a push below that could re-expose the 25,266 support. Thats where matters could get very interesting for sellers, as a breach below that level exposes bearish breakout potential down to 25k. If sellers can take that zone out, the theme around a bigger-picture sell-off will grow more attractive, and this can expose deeper support potential around 24,722 followed by 24,286.
在道琼斯指数的看跌方面,卖家可能希望在看到进一步的下跌之前看到近期高位低点被打破。最近的高点显示在25,544点附近,如果跌破则可能重新暴露25,266支撑位。这个问题对于卖家来说非常有趣,因为这个漏洞低于lvel将看跌突破潜力下调至25k。如果卖家可以将该区域排除在外,围绕更大幅度抛售的主题将变得更具吸引力,这可以在24,722左右暴露出更深的支撑潜力,然后是24,286。
Dow Jones Two-Hour Price Chart
Dow琼斯两小时价格图表

Chart prepared by James Stanley
图表由James Stanley编写
Disclaimer:
The views in this article only represent the author's personal views, and do not constitute investment advice on this platform. This platform does not guarantee the accuracy, completeness and timeliness of the information in the article, and will not be liable for any loss caused by the use of or reliance on the information in the article.
WikiFX Broker
Latest News
Why Even the Highly Educated Fall Victim to Investment Scams?
Warning Against Globalmarketsbull & Cryptclubmarket
BSP Shuts Down Uno Forex Over Serious AML Violations
ACY Securities Expands Global Footprint with South Africa Acquisition
Tokyo Police Arrest 4 for Unregistered FX Trading Scheme
Rupee gains against Euro
Axi Bids AUD 52M to Acquire Low-Cost Broker SelfWealth, Outbidding Competitor Bell Financial
Crypto Influencer's Body Found Months After Kidnapping
US Regulators Tighten Oversight on Bank Anti-Money Laundering Efforts
Doo Group Expands Its Operations with CySEC License
Currency Calculator


