简体中文
繁體中文
English
Pусский
日本語
ภาษาไทย
Tiếng Việt
Bahasa Indonesia
Español
हिन्दी
Filippiiniläinen
Français
Deutsch
Português
Türkçe
한국어
العربية
Gold Prices Eye Yields, US Dollar Response to IMF Outlook Update
Abstract:Gold prices will seek direction cues in the response from bond yields and the US Dollar to the latest update of the IMF World Economic Outlook.
GOLD & CRUDE OIL TALKING POINTS:
Gold prices rise but technical topping signs remain intact
Crude oil prices rise to five-month high on Libya tensions
Grim IMF economic outlook update might spook markets
Gold prices rose as the US Dollar weakened yesterday, in a move that seemed to reflect the dovish implications of a surprise drop in wage inflation reported Friday on Fed policy bets. Crude oil prices rose as on-going tensions in Libya drove supply disruption fears.
GRIM IMF OUTLOOK UPDATE MAY SPOOK FINANCIAL MARKETS
Looking ahead, the spotlight turns to an updated edition of the IMF World Economic Outlook (WEO). The fund has launched its annual spring meeting alongside the World Bank and this release will set the stage. A downbeat tone echoing recent deterioration in global growth may sour risk appetite.
This might weigh on bond yields and stoke haven demand for the US Dollar, offering conflicting cues to gold prices. The relative potency of these forces relative to each other is likely to shape price action. Traders may withhold conviction altogether as minutes from last months FOMC meeting loom ahead.
The response from pro-cyclical oil prices may be more straight-forwardly negative. Separately, the EIA short-term energy outlook and API inventory flow data will hit the wires. The latter will be judged against bets on a 2.48-million-barrel inflow. The former put output at a record 12.3mb/d in 2019 last month.
See the latest gold and crude oil forecasts to learn what will drive prices in the second quarter!
GOLD TECHNICAL ANALYSIS
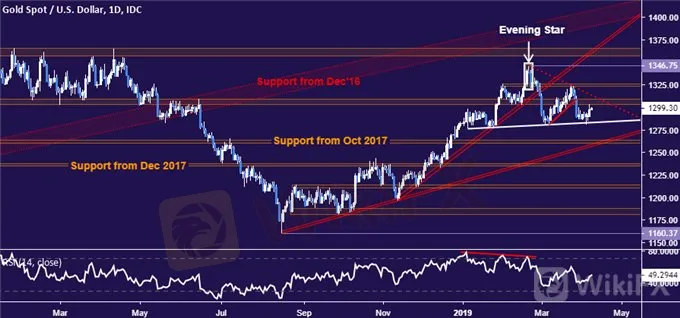
Gold prices bounced to retest resistance in the 1303.70-09.12 but the outlines of a choppy Head and Shoulders (H&S) top remain intact. The outer bound of the latest series of lower highs is now at 1313.45, with a daily close above that likely needed to neutralize near-term bearish cues. The next upside threshold is at 1326.30. Alternatively, confirmation of the H&S setup on break below its neckline – now at 1283.41 – sets the stage for a test of trend line support set from August 2018. This is currently at 1256.73.

CRUDE OIL TECHNICAL ANALYSIS
Crude oil prices rose to a five-month high to challenge support-turned-resistance in the 63.59-64.88 zone. This is swiftly followed by the 66.09-67.03 inflection area. A turn lower from here eyes rising trend line support set from late December. The outer layer of that barrier is now at 59.79, with a daily close above below that initially targets the 57.24-88 region.
Disclaimer:
The views in this article only represent the author's personal views, and do not constitute investment advice on this platform. This platform does not guarantee the accuracy, completeness and timeliness of the information in the article, and will not be liable for any loss caused by the use of or reliance on the information in the article.
Read more

KVB Today's Analysis: USD/JPY Eyes Volatility Ahead of BoJ Policy Meeting and US Data
The USD/JPY pair rises to 154.35 during the Asian session as the Yen strengthens against the Dollar for the fourth consecutive session, nearing a 12-week high. This is due to traders unwinding carry trades ahead of the Bank of Japan's expected rate hike and bond purchase tapering. Recent strong US PMI data supports the Federal Reserve's restrictive policy. Investors await US GDP and PCE inflation data, indicating potential volatility ahead of key central bank events.

Today's analysis: USDJPY Poised for Increase Amid Bank of Japan's Strategy
The USD/JPY is expected to rise. The Bank of Japan will keep interest rates between 0 and 0.1% and continue its bond purchase plan but may reduce purchases and raise rates in July based on economic data. Technically, the pair is trending upward with resistance at $158.25 and $158.44, and support at $157.00, $156.16, and $155.93.

March 21, 2024 DAILY MARKET NEWSLETTER: Fed Hints at Rate Cuts, Stocks Surge
Consider including the date in your title for clarity.

Daily Market Newsletter - March 12, 2024: Market Recap: S&P 500 and Nasdaq Decline, Bitcoin Boosts Microstrategy to Record Highs
Insights from Trading Central's Global Research Desks
WikiFX Broker
Latest News
BI Apprehends Japanese Scam Leader in Manila
Bitcoin in 2025: The Opportunities and Challenges Ahead
Join the Event & Level Up Your Forex Journey
Is There Still Opportunity as Gold Reaches 4-Week High?
Bitcoin miner\s claim to recover £600m in Newport tip thrown out
Good News Malaysia: Ready for 5% GDP Growth in 2025!
How to Automate Forex and Crypto Trading for Better Profits
FXCL Lucky Winter Festival Begins
Warning Against MarketsVox
Is the stronger dollar a threat to oil prices?
Currency Calculator


