简体中文
繁體中文
English
Pусский
日本語
ภาษาไทย
Tiếng Việt
Bahasa Indonesia
Español
हिन्दी
Filippiiniläinen
Français
Deutsch
Português
Türkçe
한국어
العربية
Oil Risks Larger Recovery as Inverse Head-and-Shoulders Takes Shape
Abstract:Ongoing efforts by the OPEC and its allies may spur a larger recovery in crude oil prices as an inverse head-and-shoulders formation takes shape.
Oil Talking Points
Oil prices remain bid even as the International Monetary Fund (IMF) reduces its global growth forecast for 2019 and 2020, and the ongoing efforts by the Organization of the Petroleum Exporting Countries (OPEC) to stabilize the energy market may spur a larger recovery in crude as an inverse head-and-shoulders formation takes shape.
Fresh comments from OPEC Secretary-General Mohammad Barkindo suggest the group will continue to cut production over the coming months as the official insists that the ‘the market has started to respond positively’ at the World Economic Forum in Davos, Switzerland, and the current environment raises the risk for higher crude prices as Mr. Barkindo goes onto say that ‘we are beginning to see very sharp reductions in supply.’

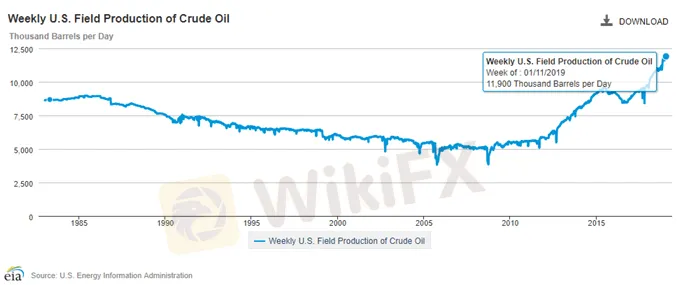
In fact, OPEC and its allies may curb production throughout 2019 as updates from the U.S. Energy Information Administration (EIA) show field production climbing to 11,900K in the week ending January 11 after holding steady at 11,700K for three consecutive weeks, and the group may continue to combat the stickiness in Non-OPEC supply especially as Russia Minister of Energy, Alexander Novak¸ endorses a price range of $55-65bbl.
With that said, the advance from the December-low ($42.36) may gather pace as oil prices break out of the downward trend carried over from late-2018, with developments in the Relative Strength Index (RSI) fostering a constructive outlook for crude as the oscillator bounces back from oversold territory and carves a bullish formation. Sign up and join DailyFX Currency Analyst David Song LIVE for an opportunity to discuss potential trade setups.
Oil Daily Chart

Crude stages a near-term rebound following the failed attempts to test the June 2017-low ($42.05), and oil prices may continue to track higher as an inverse head-and-shoulders formation takes shape.
In turn, a break/close above the $55.10 (61.8% expansion) to $55.60 (61.8% retracement) region raises the risk for a larger reversal, with the next area of interest coming in around $57.40 (61.8% retracement) followed by the Fibonacci overlap around $59.00 (61.8% retracement) to $59.70 (50% retracement).
For more in-depth analysis, check out the 1Q 2019 Forecast for Oil
Additional Trading Resources
Are you looking to improve your trading approach? Review the ‘Traits of a Successful Trader’ series on how to effectively use leverage along with other best practices that any trader can follow.
Want to know what other markets the DailyFX team is watching? Download and review the Top Trading Opportunities for 2019.
Disclaimer:
The views in this article only represent the author's personal views, and do not constitute investment advice on this platform. This platform does not guarantee the accuracy, completeness and timeliness of the information in the article, and will not be liable for any loss caused by the use of or reliance on the information in the article.
WikiFX Broker
Latest News
BSP Shuts Down Uno Forex Over Serious AML Violations
ACY Securities Expands Global Footprint with South Africa Acquisition
Rupee gains against Euro
Tokyo Police Arrest 4 for Unregistered FX Trading Scheme
US Regulators Tighten Oversight on Bank Anti-Money Laundering Efforts
Doo Group Expands Its Operations with CySEC License
RM900,000 Scammed: The Hidden Dangers of Online Investment Schemes
5 Advantages of Choosing a Regulated Broker
Axi Bids AUD 52M to Acquire Low-Cost Broker SelfWealth, Outbidding Competitor Bell Financial
Crypto Influencer's Body Found Months After Kidnapping
Currency Calculator


