简体中文
繁體中文
English
Pусский
日本語
ภาษาไทย
Tiếng Việt
Bahasa Indonesia
Español
हिन्दी
Filippiiniläinen
Français
Deutsch
Português
Türkçe
한국어
العربية
KVB Market Analysis | 1 Nov: Gold Prices Retreat from Record Highs Amidst Strong U.S. Economic Data
Zusammenfassung:Product: EUR/USDPrediction: IncreaseFundamental Analysis:The EUR/USD pair has risen to 1.0885 in early Asian trading on Friday, supported by a weakening U.S. Dollar. Traders are focused on the U.S. No
Product: EUR/USD
Prediction: Increase
Fundamental Analysis:
The EUR/USD pair has risen to 1.0885 in early Asian trading on Friday, supported by a weakening U.S. Dollar. Traders are focused on the U.S. Nonfarm Payrolls report due later today.
The pair has extended its weekly gains, marking a fourth consecutive day of increases and nearing the 200-day Simple Moving Average at 1.0870, close to the key 1.0900 level.
Expectations for a 25-basis-point rate cut by the Federal Reserve next month are growing, while the European Central Bank recently cut rates to 3.25%, with officials cautious about future decisions. The U.S. economy's strength may help the Dollar remain strong in the near term.
Technical Analysis:
Further gains could push EUR/USD to the weekly high of 1.0887, followed by the 100-day and 55-day SMAs at 1.0935 and 1.1019, respectively. The 2024 peak of 1.1214 is next, ahead of the 2023 high of 1.1275.
On the downside, initial support is at the October low of 1.0760, then at the round number 1.0700, and the June low of 1.0666.
If EUR/USD constantly clears the 200-day SMA, the outlook will likely become more positive. The four-hour chart shows a rebound, with resistance at 1.0887 and support at 1.0760. The RSI is around 60.

Product: XAU/USD
Prediction: Increase
Fundamental Analysis:
Spot Gold faced strong selling pressure after Wall Street opened, dropping sharply from record highs to around $2,731.45. A risk-averse mood swept through the markets on Wednesday following U.S. data that showed solid economic growth and a healthy labor market, dampening expectations for interest rate cuts.
The Federal Reserve will meet next week to announce its monetary policy on November 7, with a 94.5% chance of a 25 basis point cut, slightly down from 95.5% the previous week. Meanwhile, the Bank of Japan kept its interest rate target at 0.25%, supporting the U.S. Dollar.
Initial Jobless Claims fell to 216K, and the September Personal Consumption Expenditures Price Index showed a 2.1% year-over-year increase. Attention now turns to the U.S. Nonfarm Payrolls report, expected to show 113K new jobs added in October, with the unemployment rate steady at 4.1%.
Technical Analysis:
The XAU/USD pair has lost most of its weekly gains, and the daily chart suggests that the decline may continue, though it isn't in a bearish trend. Technical indicators have sharply retreated from overbought levels and are trending downward but remain above their midlines. The pair is still above all moving averages, which are bullish, with the 20 Simple Moving Average around $2,696.00 providing dynamic support.
In the near term, the 4-hour chart indicates a downside risk. XAU/USD has fallen below its 20 SMA, which has lost its bullish momentum around $2,766.00. However, the 100 and 200 SMAs continue to rise below the current level. Technical indicators have moved into negative territory, suggesting further declines ahead.

Product: GBP/USD
Prediction: Decrease
Fundamental Analysis:
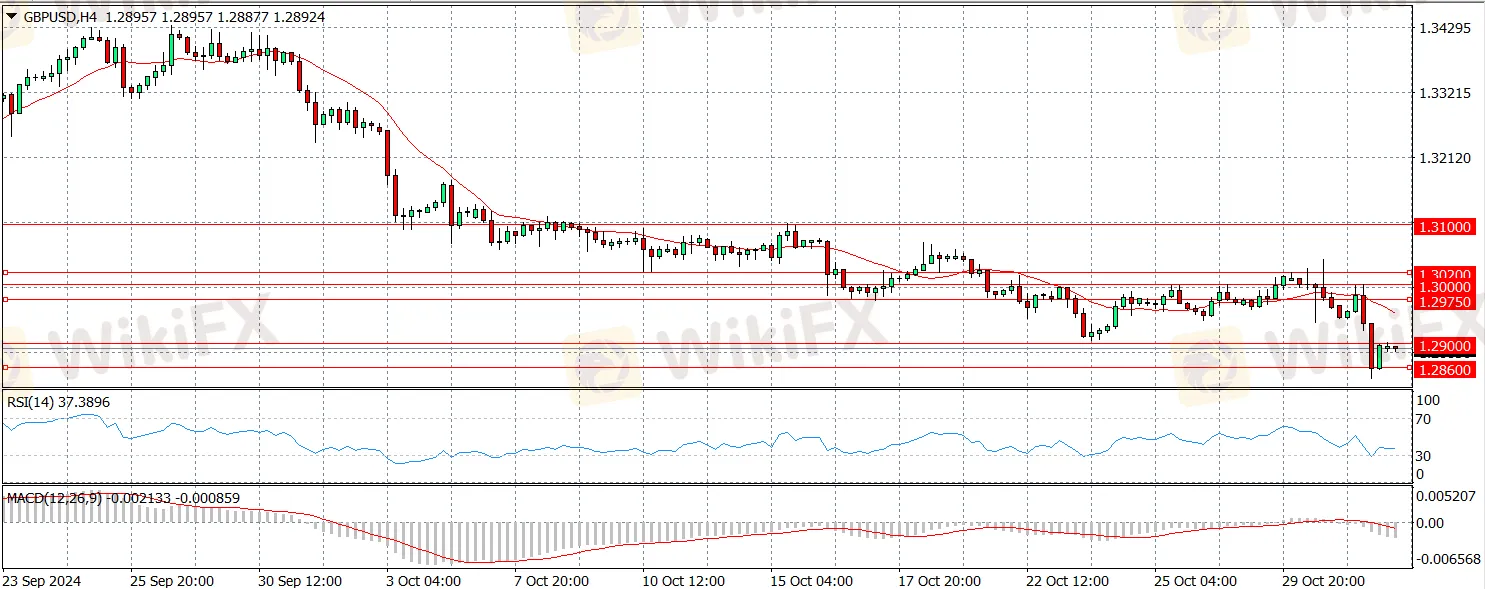
The GBP/USD pair is under pressure, trading around 1.2895, its lowest point since August 16, during early Asian hours on Friday. The pair declined after the UK Labour government released its first Autumn Forecast Statement on Wednesday.
Although GBP/USD closed negatively on Wednesday, it opened slightly higher on Thursday but remains below 1.3000. Rising UK gilt yields after the Autumn Budget announcement have helped the Pound stay relatively strong. The 2-year gilt yield hit its highest level since mid-July, while the 20-year yield reached over 4.8%.
Despite this, GBP/USD struggles to gain momentum as the U.S. Dollar benefits from a risk-averse market. U.S. stock futures are down, and investors are watching the Initial Jobless Claims data, expecting a drop to 227,000 from 230,000. If claims rise toward 250,000, it could negatively affect the USD. However, GBP/USD may find it hard to rebound if safe-haven flows continue to dominate.
Technical Analysis:
The Relative Strength Index on the 4-hour chart is close to 50, indicating weak bullish momentum. On the upside, immediate resistance is at 1.3020, followed by 1.3100 and 1.3140.
On the downside, key support is at 1.2975, where the 100-day Simple Moving Average is located. If GBP/USD drops below this level and begins to use it as resistance, it could continue to decline toward 1.2900.

Haftungsausschluss:
Die Ansichten in diesem Artikel stellen nur die persönlichen Ansichten des Autors dar und stellen keine Anlageberatung der Plattform dar. Diese Plattform übernimmt keine Garantie für die Richtigkeit, Vollständigkeit und Aktualität der Artikelinformationen und haftet auch nicht für Verluste, die durch die Nutzung oder das Vertrauen der Artikelinformationen verursacht werden.
WikiFX-Broker
Aktuelle Nachrichten
XRP & Ripple unstoppable: Bist du bereit für die Mega-Rally 2025?
Ethereum & ETH-Prognose: Gehts 2025 auf 7.000 US-Dollar?
US-Dollar Jahresprognose: Starke Erholung und positive Aussichten für 2025
Bitcoin-Preisprognose: BTC erholt sich nicht, Metaplanet kauft die Delle auf
Goldpreis Jahresprognose: 2025 wieder ein Rekordjahr?
Tanken: Dieses Jahr war eines der teuersten an der Zapfsäule – 2025 könnte etwas billiger werden
Ständig kaputt und für Nachteinsätze ungeeignet: Interner Bericht zeigt, wie schlecht es um die deutschen Zivilschutzhubschrauber steht
Russlands oberste Zentralbankerin ist besorgt über eine „übermäßige Abkühlung der Kriegswirtschaft
Rente mit 63: Warum diese Top-Ökonomin fordert, das Modell sofort abzuschaffen
Litecoin Preisprognose: LTC versucht den Widerstand bei $100 zurückzuerobern, da Miner den Ausverkauf stoppen
Wechselkursberechnung


