简体中文
繁體中文
English
Pусский
日本語
ภาษาไทย
Tiếng Việt
Bahasa Indonesia
Español
हिन्दी
Filippiiniläinen
Français
Deutsch
Português
Türkçe
한국어
العربية
FPG USTEC Market Report December 30, 2024
Sommario:The USTEC index has maintained its dominant bullish trend since reversing direction in August 2024. The index currently trades at 21,450.79, finding support along a diagonal trendline that has sustain
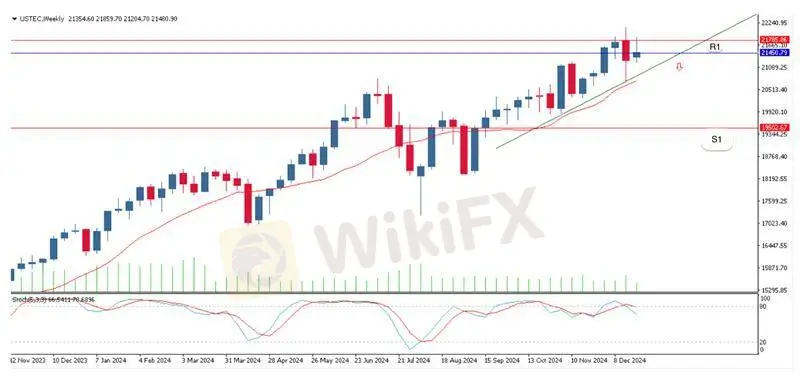
The USTEC index has maintained its dominant bullish trend since reversing direction in August 2024. The index currently trades at 21,450.79, finding support along a diagonal trendline that has sustained its upward momentum. However, a failed attempt to break through the R1 resistance level suggests waning bullish strength, while overbought conditions indicated by the stochastic oscillator could lead to a potential trend reversal.
On the weekly timeframe, USTEC remains above its trendline support, confirming its bullish structure. The index attempted to break through the R1 resistance level at 21,785.86 but was unable to sustain the breakout, leading to a slight retracement. The stochastic oscillator, currently in the overbought territory near 80, signals a potential reversal or consolidation phase. If the index breaches the trendline support, the bearish trend could dominate, targeting lower levels, including S1 support at 19,502.67.

Market Observation & Strategy Advice:
1.Key Levels to Watch: Resistance at 21,785.86 (R1) and support at 19,502.67 (S1).
2.Bullish Momentum: The diagonal trendline serves as critical support, sustaining the uptrend.
3.Reversal Risk: Overbought stochastic levels increase the likelihood of a trend reversal. A break below the trendline could signal bearish dominance.
4.Trading Opportunity: Traders should monitor for a sustained breakout above R1 for long positions, while maintaining stop-losses below the trendline. Alternatively, short positions may be considered if the trendline is breached.
Market Indices Performance:
Index Last % Change
S&P 500 5,970.84 -1.11%
Dow Jones 42,992.21 -0.77%
Nasdaq 19,722.03 -1.49%
Today's Key Economic Calendar:
US: Pending Home Sales MoM, Chicago PMI
UK: Nationwide Housing Prices MoM
EU: Consumer Confidence Final
JP: Industrial Production MoM
CH: Manufacturing PMI
Risk Disclaimer This report is for informational purposes only and does not constitute financial advice. Investments involve risks, and past performance does not guarantee future results. Consult your financial advisor for personalized investment strategies.
Disclaimer:
Le opinioni di questo articolo rappresentano solo le opinioni personali dell’autore e non costituiscono consulenza in materia di investimenti per questa piattaforma. La piattaforma non garantisce l’accuratezza, la completezza e la tempestività delle informazioni relative all’articolo, né è responsabile delle perdite causate dall’uso o dall’affidamento delle informazioni relative all’articolo.
WikiFX Trader
WikiFX Trader
Rate Calc


