简体中文
繁體中文
English
Pусский
日本語
ภาษาไทย
Tiếng Việt
Bahasa Indonesia
Español
हिन्दी
Filippiiniläinen
Français
Deutsch
Português
Türkçe
한국어
العربية
How to Use RSI (Relative Strength Index)
abstrak:The Relative Strength Index (RSI) describes a momentum indicator that measures the magnitude of recent price changes in order to evaluate overbought or oversold conditions in the price of a stock or other asset.
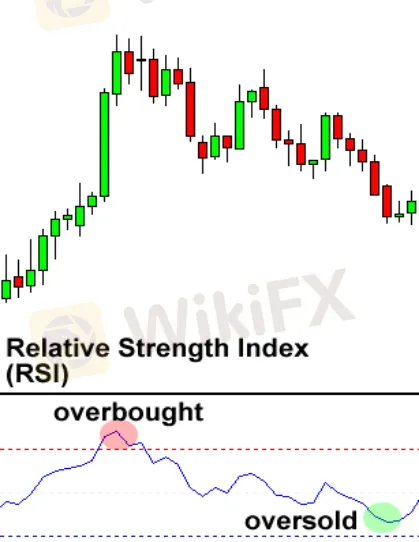
The Relative Strength Index (RSI) describes a momentum indicator that measures the magnitude of recent price changes in order to evaluate overbought or oversold conditions in the price of a stock or other asset. Originally developed by noted American technical analyst J. Welles Wilder Jr., who introduced the concept in his seminal 1978 book, “New Concepts in Technical Trading Systems,”1 the RSI is displayed as an oscillator, which is a line graph that moves between two extremes. Its reading can range from 0 to 100. Clearly, with readings of 30 or lower signifies oversold market conditions and an increase in the change of price strengthening (going up).
Among traders, some explained that an oversold or overpriced currency pair is a sign that the falling trend is possibly to reverse, which means it‘s a chance to buy. And Readings of 70 or higher signify overbought conditions and an increase in the likelihood of price weakening (going down). While other traders analyze that an overbought currency pair is an sign that the rising trend is likely to reverse, which means it’s a chance to sell.

Moreover, talking about the overbought and oversold indicators explained above, traders who use the Relative Strength Index (RSI) indicator also look for centerline crossovers. A movement from below the centerline (50) to above indicates a rising trend.
Centerline crossoversare the next most common MACD signals. A bullish centerline crossover occurs when the MACD line moves above the zero line to turn positive. This happens when the shorter EMA of the underlying security moves above the longer EMA.
Similarly we can say
A rising centerline crossover occurs when the RSI value crosses over the 50 line and move towards to the 70 line. This indicates the market trend is increasing in strength, and is seen as a bullish signal until the RSI approaches the 70 line.
A bearish centerline crossover occurs when the MACD moves below the zero line to turn negative. This happens when the shorter EMA moves below the longer EMA. A movement
from above the centerline (50) to below indicates a falling trend.
A falling centerline crossover occurs when the RSI value crosses below the 50 line on the scale, moving towards the 30 line. This indicates the market trend is weakening in strength, and is seen as a bearish signal until the RSI approaches the 30 line.
How to Trade Using RSI
As explained earlier that , relative strength index (RSI) is most commonly used to indicate short term overbought or oversold conditions in a market. Therefore it can be used in a similar way to Stochastic indicator. It can use to pick potential tops and bottoms depending on regardless the market is overbought or oversold.
Below is a 4-hour chart of EUR/USD.

EUR/USD had been dropping the week, falling about 400 pips over the course of two weeks. On June 7, it was already trading below the 1.2000 handle. Although, RSI dropped below 30, giving a sign that perhaps no more sellers left in the market and that the move could be over. Price then change and headed back up over the next more weeks.
Determining the Trend using RSI
A side from the use of TSI in determining overbought and oversold, it can be used to also confirm trend formations which makes it a very effective and popular trading tool. If you experience a trend is forming, take a quick look at the RSI and look at regardless it is above or below 50.
If you are looking at a possible uptrend, then make sure the RSI is above 50. While If you are looking at a possible downtrend, then make sure the RSI is below 50.

At the beginning of the chart above, we can see that a possible downtrend was forming. To stay away from fakeouts, we can wait for RSI to cross below 50 to confirm our trend. For sure, the RSI passes below 50, it is a solid proof that a downtrend was setup.
Disclaimer:
Ang mga pananaw sa artikulong ito ay kumakatawan lamang sa mga personal na pananaw ng may-akda at hindi bumubuo ng payo sa pamumuhunan para sa platform na ito. Ang platform na ito ay hindi ginagarantiyahan ang kawastuhan, pagkakumpleto at pagiging maagap na impormasyon ng artikulo, o mananagot din para sa anumang pagkawala na sanhi ng paggamit o pag-asa ng impormasyon ng artikulo.
Broker ng WikiFX
Pinakabagong Balita
Elementarya: Mga Antas ng Suporta at Paglaban
Paano I-trade ang Suporta at Paglaban
Cheat Sheet ng Mga Pattern ng Trading Chart
Paano Mag-trade ng Double Tops at Double Bottoms
Trading Gamit ang Tatlong Time Frame
Anong Time Frame ang Pinakamahusay para sa Trading?
Buod: Currency Crosses
Paano Gumamit ng Multiple Time Frame Analysis para Makahanap ng Mas Mahusay na Entry at Exit Points
Pag te-Trading ng Euro at ang Yen Crosses
Bakit Tumawid ang Trade Currency?
Exchange Rate


