简体中文
繁體中文
English
Pусский
日本語
ภาษาไทย
Tiếng Việt
Bahasa Indonesia
Español
हिन्दी
Filippiiniläinen
Français
Deutsch
Português
Türkçe
한국어
العربية
Meta Trader 4: The Complete Guide
Extracto:Meta Trader 4 is considered by many to be the gold standard brand for forex trading platforms. Retail traders who have signed up with multiple brokers will have likely run into a trading platform driven by Meta Trader

Getting Started with Meta Trader 4
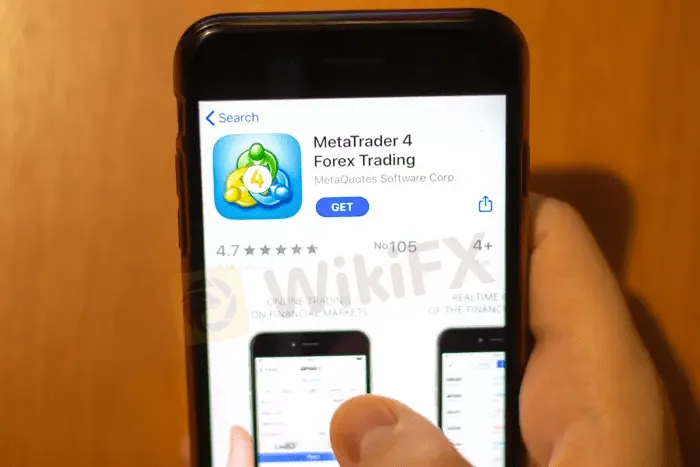
Meta Trader 4 is intuitive and relatively easy to use. You can start by opening a demonstration account that allows you to test drive the system without making a deposit. You simply need to provide a broker that uses Meta Trader Platforms, your personal information including your email and they will send you a login and password to open a demonstration account.
A demonstration account uses demonstration money and allows you to see how the platform works without risking real capital. Dont be afraid to place multiple trades so you understand how to execute and order and view your positions.

The first page you see when you open Meta Trader 4, can be customized as your default page. You might want to see forex quotes along with a chart as an example. On the left side is a quote sheet. It shows you a list of products that you can trade through the MT4 platform.
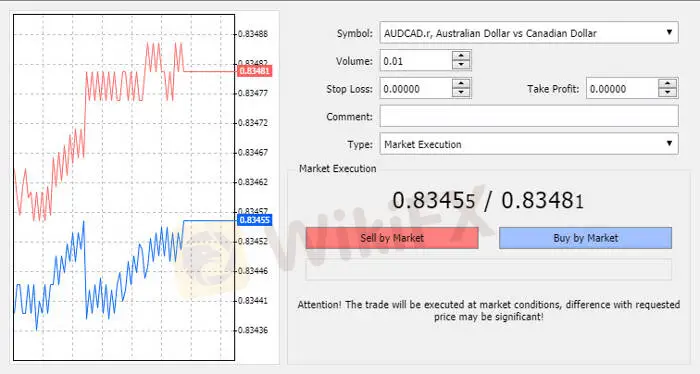
You can double-click on any of the items on the quote sheet and it will bring up an order page. Here you can see a graph of a tick chart along with the asset you are planning to trade. You can fill in your volume and place a stop loss and take profit orders. This allows you to set your risk management before you even place your trade.
Additionally, you can have a 1-click trading box in the upper left side that allows you to instantly place a trade. You can place your trade using market execution or pending order. You also can determine the volume of your trade. Below is the bid-offer spread. As a market taker, you buy on the offer (the blue) and sell on the bid (the red).

Navigating through Meta Trader 4 is intuitive and designed to give you easy access to all of the destinations available on the platform. You can customize your home page to see any page, including seeing your positions.
The demo account has a tab system on the bottom left, that opens to the common tab, where you can see charts of the major currency pairs. You can change that to see daily, weekly or any intra-day period. You can create several tabs that provide a view that you want to see.
Above the tabs is a navigator that allows you to see technical indicators as well as expert advisors and scripts. Technical indicators allow you to perform technical analysis of different assets. An expert advisor is a system that can be back-tested to understand the performance of an automated trading signal over time. Scripts allow you to drive alerts and run automated trading scenarios.

If you double-click in indicators in the menu of the navigator, you will a plenty of technical indicators that can be customized. In the graph above, the MACD (moving average convergence divergence) indicator is shown, along with a pop up of a custom input that you can use to change the standard MACD.
You can change the number of units (days, weeks, months, etc…) as inputs along with the colors used to generate a MACD indicator. The MACD shows both the MACD lines as well as the MACD histogram. There are dozens of technical indicators. You can save your favorite indicators into a tab and name favorites.

Descargo de responsabilidad:
Las opiniones de este artículo solo representan las opiniones personales del autor y no constituyen un consejo de inversión para esta plataforma. Esta plataforma no garantiza la precisión, integridad y actualidad de la información del artículo, ni es responsable de ninguna pérdida causada por el uso o la confianza en la información del artículo.
Brokers de WikiFX
últimas noticias
Análisis del Dólar: Comportamiento en 2024 y Proyecciones para el Cierre del Año.
¿Qué es XFA y cómo opera su esquema de estafa?
La ASIC suspende la licencia de Equitise Pty Ltd hasta febrero de 2025.
Bitget presenta el Christmas Rally con un rendimiento 100%.
La Estafa de Warren Bowie & Smith: Una trampa que ha atrapado a múltiples clientes.
¡ALERTA! La CNMV advierte del broker TRADERS HOME.
Cálculo de tasa de cambio


